
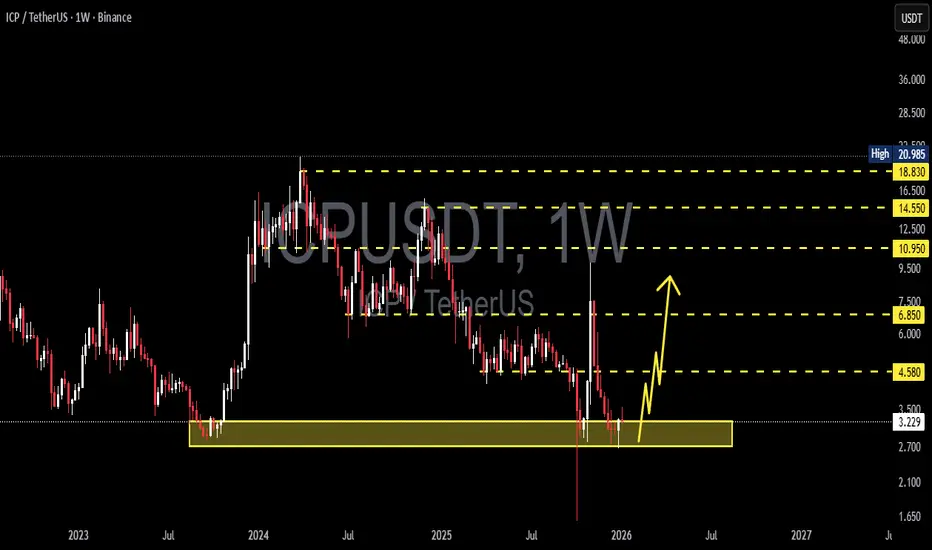
ICP/USDT on the Weekly (1W) timeframe is still moving within a long-term downtrend structure after failing to hold above the $20 area. Price has now moved lower and is currently testing a very strong historical demand zone at $3.215 – $2.200 (yellow box).
This zone previously acted as a major accumulation base before the strong bullish impulse in early 2024. Price reaction in this area will be a key determinant for the medium- to long-term trend direction.
---
Structure & Chart Pattern
Primary Trend: Bearish (Lower High & Lower Low still valid)
Current Phase: Major Demand Zone Test / Accumulation Area
Market Structure:
Breakdown from the previous consolidation structure
Price has returned to the lowest historical support area
Volatility Spike:
Presence of an extreme long lower wick → strong rejection from lower prices & potential smart money buying
---
Key Levels
Major Demand Zone:
🟨 $3.215 – $2.200 (critical make-or-break zone)
Step-by-Step Resistance Levels:
$4.580
$6.850
$10.950
$14.550
Major Supply / Higher Timeframe Resistance:
$18.830 – $20.985
---
Bullish Scenario
The bullish scenario becomes valid if and only if:
Price holds above the $3.215 – $2.200 demand zone
A weekly higher low or bullish weekly close is formed
Followed by a break and close above $4.580
Bullish Targets (Step-by-Step):
1. $4.580 (structure retest)
2. $6.850 (mid resistance)
3. $10.950 (major breakout confirmation)
4. $14.550 – $18.830 (bullish continuation zone)
📌 Note:
As long as price holds above the demand zone, ICP has the potential to form a long-term accumulation base for a major reversal.
---
Bearish Scenario
The bearish scenario will play out if:
Price records a strong weekly close below $2.200
The major demand zone fails to hold
Bearish Implications:
Breakdown of historical support
Increased risk of extended panic selling
Price may enter lower price discovery
Bearish structure becomes stronger and fully validated
📌 $2.200 is the final psychological and technical boundary.
---
Conclusion
ICP is currently at a critical long-term decision point.
The $3.215 – $2.200 zone represents a major decision area:
Holding the zone → potential reversal & accumulation
Breaking the zone → extreme bearish continuation
Aggressive positioning is not recommended until a clear weekly close confirmation is observed.
---
#ICP #ICPUSDT #Altcoin #CryptoAnalysis #AltcoinAnalysis #WeeklyChart #MarketStructure
#DemandZone #SupportResistance #Downtrend #PotentialReversal
#SmartMoney

✅ Get Free Signals! Join Our Telegram Channel Here: t.me/TheCryptoNuclear
✅ Twitter: twitter.com/crypto_nuclear
✅ Join Bybit : partner.bybit.com/b/nuclearvip
✅ Benefits : Lifetime Trading Fee Discount -50%
✅ Twitter: twitter.com/crypto_nuclear
✅ Join Bybit : partner.bybit.com/b/nuclearvip
✅ Benefits : Lifetime Trading Fee Discount -50%
Disclaimer
The information and publications are not meant to be, and do not constitute, financial, investment, trading, or other types of advice or recommendations supplied or endorsed by TradingView. Read more in the Terms of Use.