Understanding Bull & Bear Flags: A Practical Guide for Traders
Understanding Bull & Bear Flags: A Practical Guide for Traders
1. What Are Bull and Bear Flags?
Bull and bear flags are continuation patterns.
A bull flag forms after a strong upward impulse. Price pauses, drifts slightly downward or sideways, and builds a controlled consolidation channel. When it breaks upward again, the trend continues.

A bear flag is the opposite. After a sharp downward leg, price retraces upward inside a tight rising channel. When it breaks down again, the downtrend resumes.

Both structures show the same market behavior:
A temporary pause before the dominant trend returns with force.
Most traders know bull flags. Far fewer pay real attention to bear flags, but only professionals identify & trade them properly.
2. How to Spot Them (and My Checklist to Validate Them)
Spotting them is simple once you know the key ingredients:
My Bull/Bear Flag Checklist:
✔ Strong impulsive move (clean pole)
✔ Tight consolidation (not messy, not sloppy)
✔ Clear parallel lines
✔ A minimum of 4–6 total contact points
✔ Breakout candle with strength
✔ Retest (pullback) optional, but if it appears, even better
✔ Risk clearly defined below/above the flag (easy, the pattern always offer you a place for SL)
If all of these align, probabilities rise dramatically. Let's see an example:

3. How Much Can I Make With a Bull Flag?
Traders often underestimate the power of this pattern.
A bull flag’s measured target is usually:
Height of the pole → projected from the breakout point. This is the classic projection, but deciding the height of the pole is imposible, there are so many possibilities.
I do prefer to project the height of the channel, much clearer.
In strong momentum markets, price often exceeds the projection of 100% and you can see 161,8% or more.

This is because the flag is essentially a pause in trend, not a reversal attempt. When buyers regain control, they push aggressively.
Typical outcomes:
Conservative target: 1× the channel
Aggressive target: 1.5–2× the channel
In exceptional momentum: 3× or more
And remember: momentum breakouts rarely return inside the flag.
Once it runs, it runs.
4. When Should I Trade Them?
The best moment is:
A. On the breakout
Clean, simple, momentum-based entry. Stop-loss goes just outside the flag.
B. On the retest or pullback (if it happens)
Often the safest entry. Not always available.
C. Never before the breakout
Trading “inside the flag” is gambling. Wait for confirmation. Let the market show its hand. You want to hunt, not to be HUNTED.
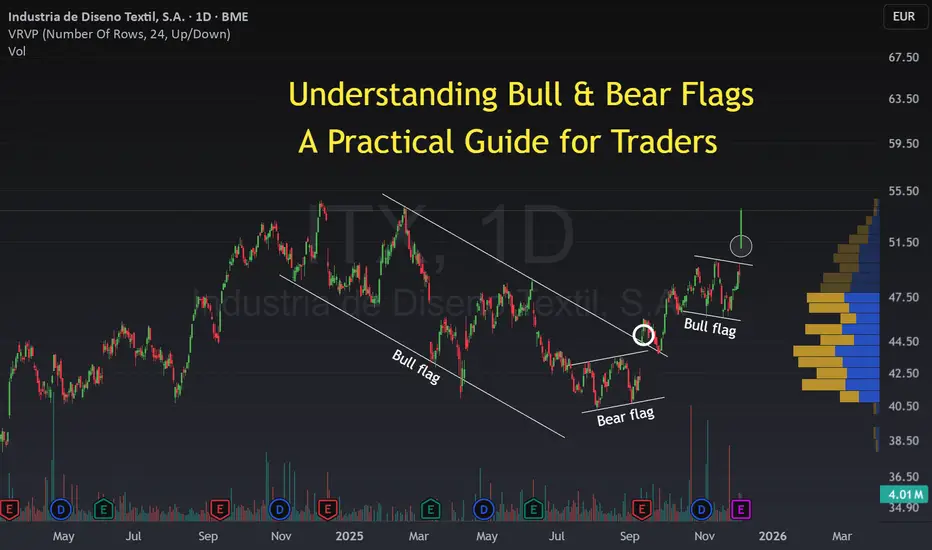
5. Real Case: Inditex and Its Three Bull/Bear Flags
Inditex offered a fantastic real-world example.
During August and early September, the market had mixed opinions:
Not bearish, maybe unimpressed.
The market was forming a Bull and a Bear flag at the same time!
A bigger bull flag showing that in the long term the feeling with ITX was bullish but a short term bear flag showing doubts for the upcoming weeks.
What Happened in September? The Surprise
Inditex published unexpectedly strong numbers and suddenly, sentiment among investors flipped.
And exactly when the fundamentals turned, the chart delivered a CLEAR AND CLEAN decision:
Flag #1 – A break of the big bull flag meaning that investors where ready to start a new bull cycle in Inditex.
Flag #2 – A break of a BEAR flag in the opposite direction. This is perfectly possible, and even though we call it a BEAR flag, if it breaks in the opposite direction it means that all the doubts suggesting lower prices were completely obliterated.
This is a perfect educational example of technical and fundamental alignment.
6. Recent Case: AAPL Bull Flag
 AAPL has recently formed a textbook bull flag and compliance with the checklist.
I’ve published a full idea on this setup, you can see more here:

🚀 If you liked this post, feel free to find more educational content in my firm! I share chart patterns, case studies, and real trading setups every week for free.
Have you ever traded bull flags before?
1. What Are Bull and Bear Flags?
Bull and bear flags are continuation patterns.
A bull flag forms after a strong upward impulse. Price pauses, drifts slightly downward or sideways, and builds a controlled consolidation channel. When it breaks upward again, the trend continues.
A bear flag is the opposite. After a sharp downward leg, price retraces upward inside a tight rising channel. When it breaks down again, the downtrend resumes.
Both structures show the same market behavior:
A temporary pause before the dominant trend returns with force.
Most traders know bull flags. Far fewer pay real attention to bear flags, but only professionals identify & trade them properly.
2. How to Spot Them (and My Checklist to Validate Them)
Spotting them is simple once you know the key ingredients:
- A strong pole: a clear previous directional move with momentum. As previous examples.
- Two parallel lines: price consolidates inside a small channel.
- At least 2–3 touches on each boundary. This is a MUST! One of the most famous guides for Bull/Bears flag fail to check this pointthat , so any movement of the market is a potential Flag! So, teaches you to trade FAKE patterns.
- Volume contraction during the flag. Not a must, but interesting to check.
- A decisive breakout: ideally supported by volume expansion.
My Bull/Bear Flag Checklist:
✔ Strong impulsive move (clean pole)
✔ Tight consolidation (not messy, not sloppy)
✔ Clear parallel lines
✔ A minimum of 4–6 total contact points
✔ Breakout candle with strength
✔ Retest (pullback) optional, but if it appears, even better
✔ Risk clearly defined below/above the flag (easy, the pattern always offer you a place for SL)
If all of these align, probabilities rise dramatically. Let's see an example:
3. How Much Can I Make With a Bull Flag?
Traders often underestimate the power of this pattern.
A bull flag’s measured target is usually:
Height of the pole → projected from the breakout point. This is the classic projection, but deciding the height of the pole is imposible, there are so many possibilities.
I do prefer to project the height of the channel, much clearer.
In strong momentum markets, price often exceeds the projection of 100% and you can see 161,8% or more.
This is because the flag is essentially a pause in trend, not a reversal attempt. When buyers regain control, they push aggressively.
Typical outcomes:
Conservative target: 1× the channel
Aggressive target: 1.5–2× the channel
In exceptional momentum: 3× or more
And remember: momentum breakouts rarely return inside the flag.
Once it runs, it runs.
4. When Should I Trade Them?
The best moment is:
A. On the breakout
Clean, simple, momentum-based entry. Stop-loss goes just outside the flag.
B. On the retest or pullback (if it happens)
Often the safest entry. Not always available.
C. Never before the breakout
Trading “inside the flag” is gambling. Wait for confirmation. Let the market show its hand. You want to hunt, not to be HUNTED.
5. Real Case: Inditex and Its Three Bull/Bear Flags
Inditex offered a fantastic real-world example.
During August and early September, the market had mixed opinions:
- Growth was slowing.
- FX conditions were challenging.
- Analysts doubted Inditex could maintain 2024-style strength.
- Conservative guidance overall. Investors expected nothing spectacular for early autumn.
Not bearish, maybe unimpressed.
The market was forming a Bull and a Bear flag at the same time!
A bigger bull flag showing that in the long term the feeling with
What Happened in September? The Surprise
Inditex published unexpectedly strong numbers and suddenly, sentiment among investors flipped.
And exactly when the fundamentals turned, the chart delivered a CLEAR AND CLEAN decision:
Flag #1 – A break of the big bull flag meaning that investors where ready to start a new bull cycle in Inditex.
Flag #2 – A break of a BEAR flag in the opposite direction. This is perfectly possible, and even though we call it a BEAR flag, if it breaks in the opposite direction it means that all the doubts suggesting lower prices were completely obliterated.
This is a perfect educational example of technical and fundamental alignment.
6. Recent Case: AAPL Bull Flag
- Strong upward pole
- Clear, parallel consolidation
- Multiple touch points
- Tight structure
- Powerful Breakout
I’ve published a full idea on this setup, you can see more here:
🚀 If you liked this post, feel free to find more educational content in my firm! I share chart patterns, case studies, and real trading setups every week for free.
Have you ever traded bull flags before?
⚡ Stop Trading the Noise. Trade Profitable Chart Patterns.
📊 I turn Market Chaos into Statistical Probabilities. 👇 Get my Weekly Opportunities here: topchartpatterns.substack.com/subscribe
📩 Business: info@topchartpatterns.com
📊 I turn Market Chaos into Statistical Probabilities. 👇 Get my Weekly Opportunities here: topchartpatterns.substack.com/subscribe
📩 Business: info@topchartpatterns.com
Related publications
Disclaimer
The information and publications are not meant to be, and do not constitute, financial, investment, trading, or other types of advice or recommendations supplied or endorsed by TradingView. Read more in the Terms of Use.