The Market Week in Review is my weekend homework where I look over what happened in the previous week and what might come in the next week. It helps me evaluate my observations, recognize new data points, and create a plan for possible scenarios in the future.
I do occasionally have some errors or typos and will correct them in my blog or in the comments on TradingView. I do not have an editor and do this in my free time.
If you find this helpful, please let me know in the comments. I am also more than happy to add new perspectives and data points if you have ideas.
The structure is the following:
If you have been following my daily updates, you can skip down to the “The Meaning of Life”. If not, then this first part is a great play-by-play recap for the week. Click the original charts for more detail each day.
-=x=-=x=-=x=-=x=-=x=-=x=-=x=-
Monday, January 4, 2021
Lately things, they don't seem the same

Facts: -1.47%, Volume higher, Closing range: 37%, Body: 63%
Good: Held support around 12,550, some recovery off lows
Bad: Thick red body, no upper wick
Highs/Lows: Higher high, lower low
Candle: Bearish engulfing candle with thick body over long lower wick
Expectation: Sideways or Lower
It was not a great start to 2021 with the equity markets selling off significantly throughout the day after making morning highs. The Nasdaq nearly reach its all-time high before selling off sharply in the morning. Recovery in the afternoon was not nearly enough to be seen as a positive. The index closed down -1.45% with a closing range of 37% and a thick red body of 63%. The higher high and lower low than the previous day represents a bearish engulfing candle that can indicate bearish sentiment in the market. There were more declining stocks than advancing stocks.
-=x=-=x=-=x=-=x=-=x=-=x=-=x=-
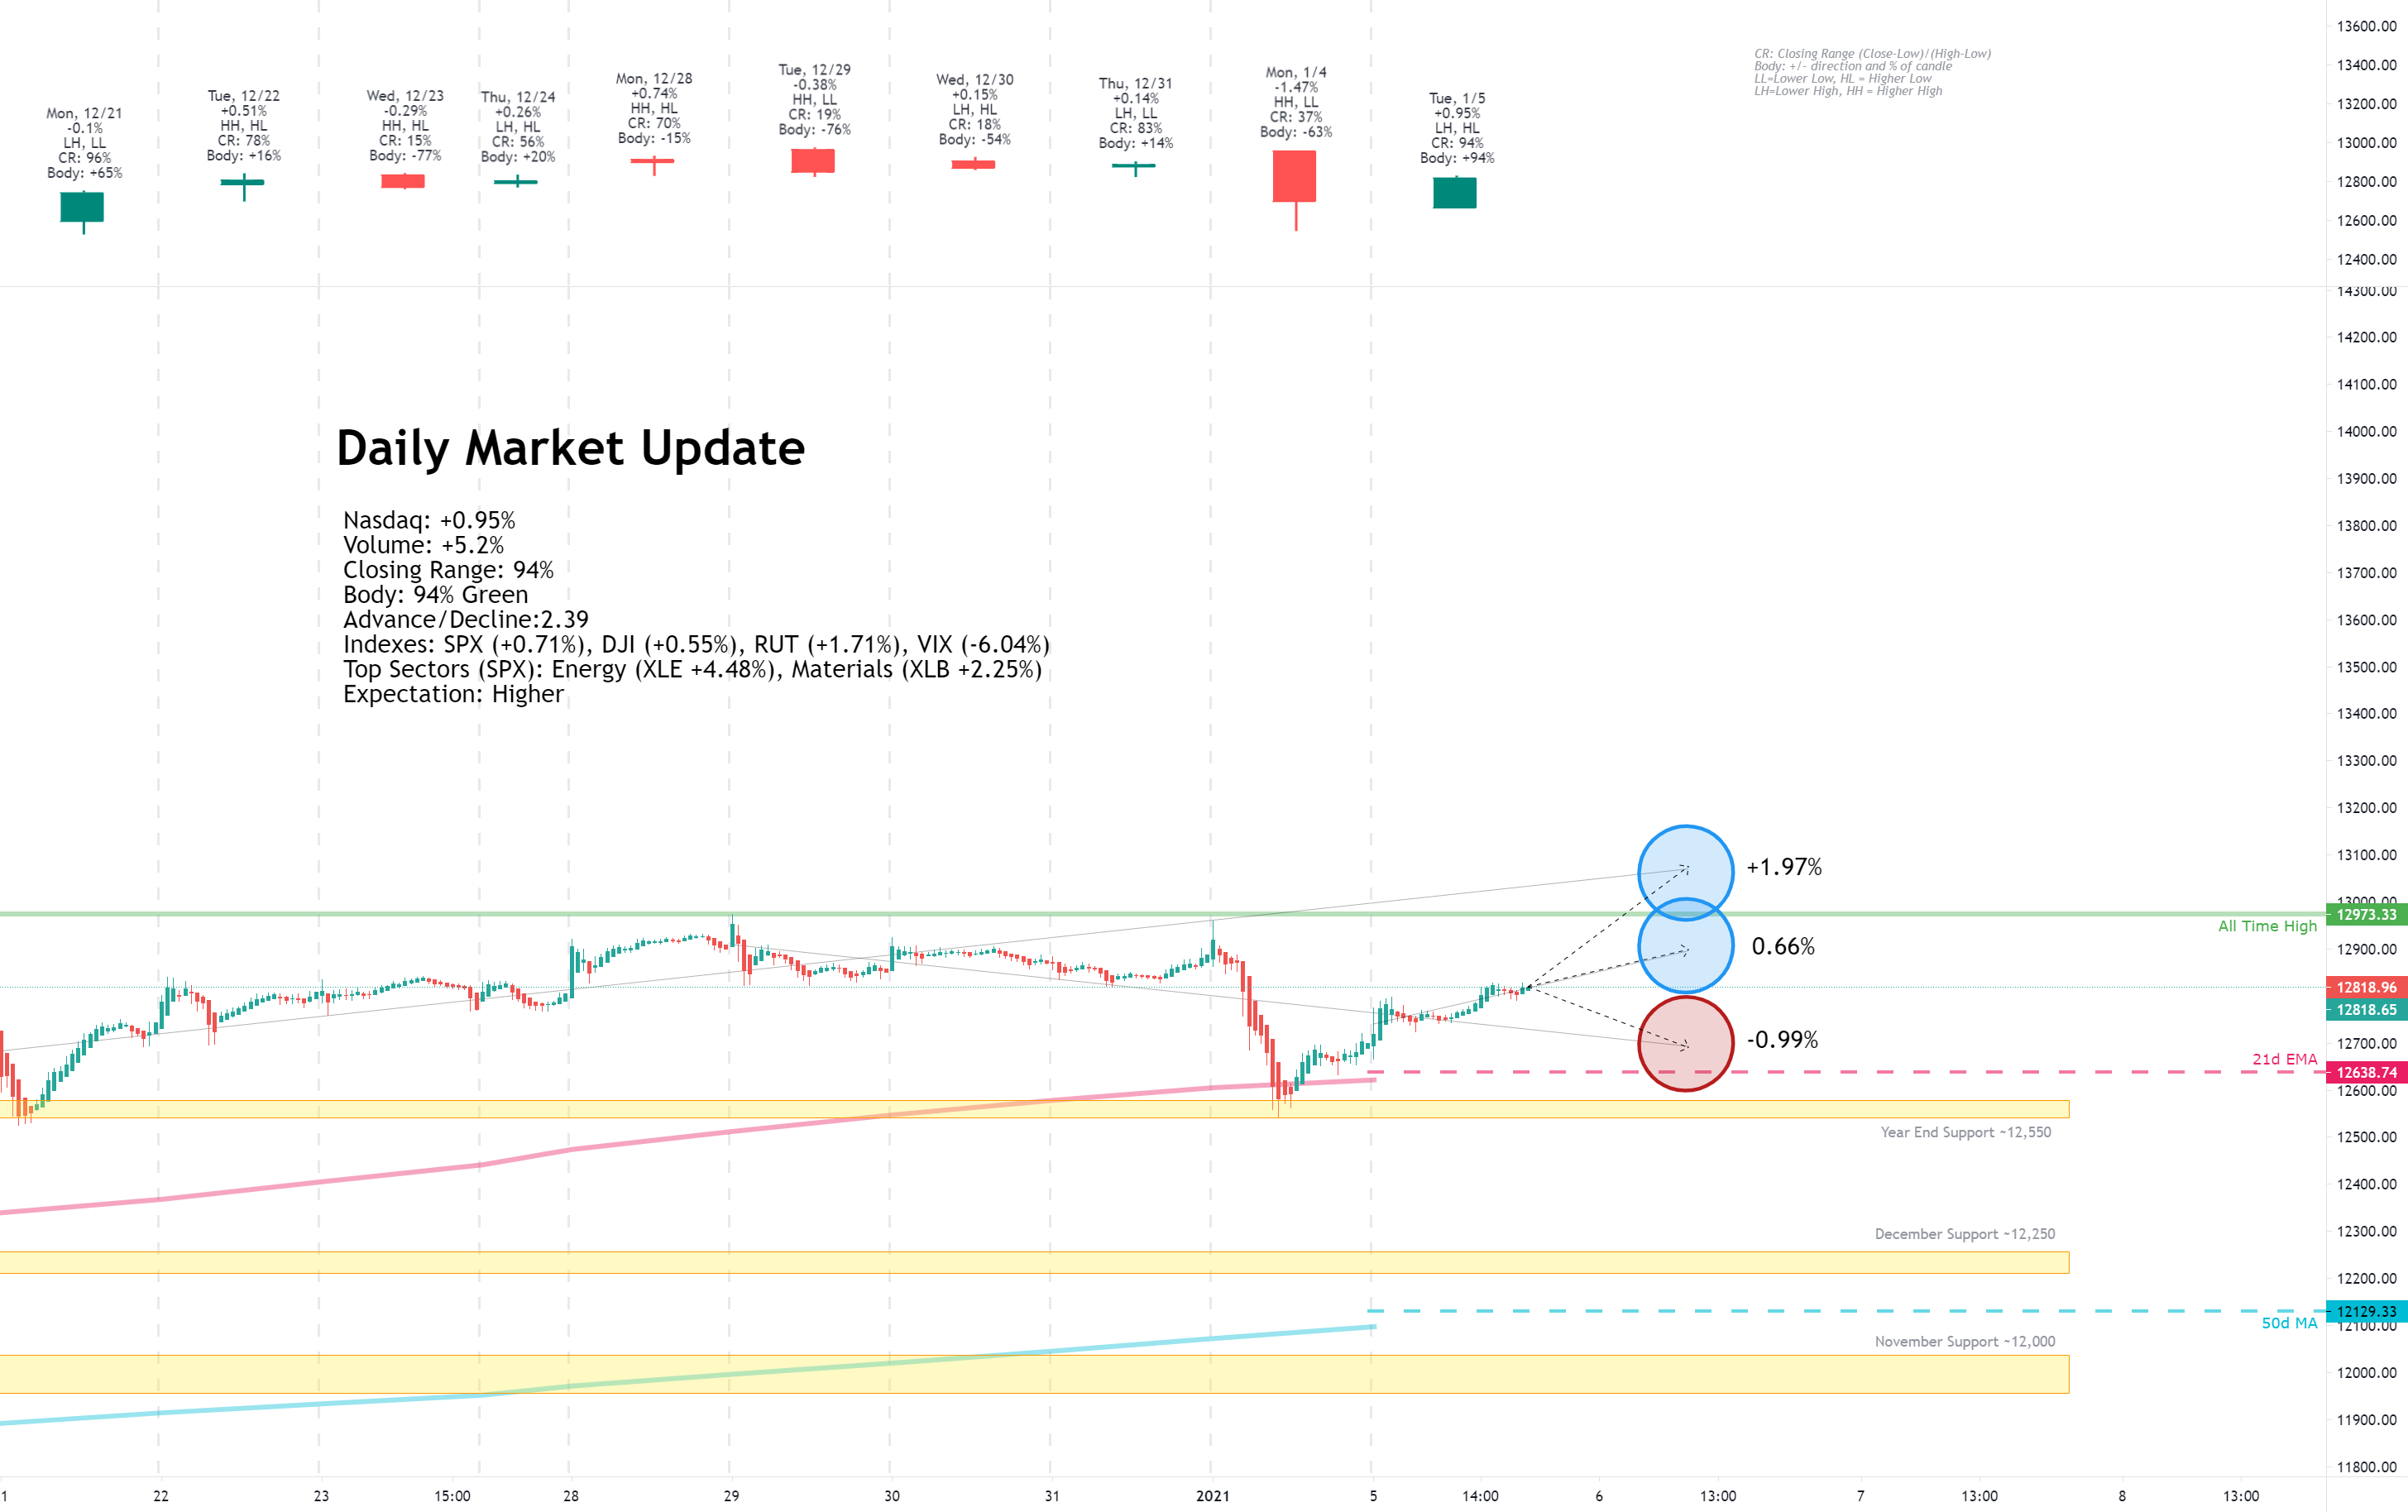
Tuesday, January 5, 2021
There must be some kind of way outta here
Facts: +0.95%, Volume higher, Closing range: 94%, Body: 94%
Good: Solid day of gains, no lower wick
Bad: Nothing
Highs/Lows: Lower high, higher low
Candle: Inside day, bullish green body with no lower wick and tiny upper wick
Expectation: Sideways or Higher
The Nasdaq followed yesterday's bearish session with a bullish rebound today. There is still work to do to get back to all-time highs, but the gains were steady throughout the day as the index never revisited the morning low. The index closed the day with a +0.95% gain on higher volume, closing range of 94% and a thick green body of 94%. The lower wick doesn't exist and the upper wick is very tiny. More than two stocks advanced for every declining stock.
-=x=-=x=-=x=-=x=-=x=-=x=-=x=-
Wednesday, January 6, 2021
Bold as Love
Facts: -0.61%, Volume higher, Closing range: 35%, Body: 29%
Good: Stayed above opening low, held support at around yesterday's low
Bad: Sell-off in late afternoon
Highs/Lows: Higher high, lower low
Candle: Inverted hammer that signals buyers held support despite selling pressure
Expectation: Sideways or Higher
It was a wild day for the markets as unbelievable events unfolded in the US capitol. The Georgia run-off elections resulted in Democrats taking control of the Senate, realizing the blue wave that was original anticipated with the November elections. The Nasdaq shook off the initial rotation and rose to gains by mid-afternoon, but would sell-off as rioters stormed the US Capitol in protest of election outcomes. The index closed -0.61% on higher volume with a closing range of 35% and a body of 29%. More stocks advanced than declined.
-=x=-=x=-=x=-=x=-=x=-=x=-=x=-
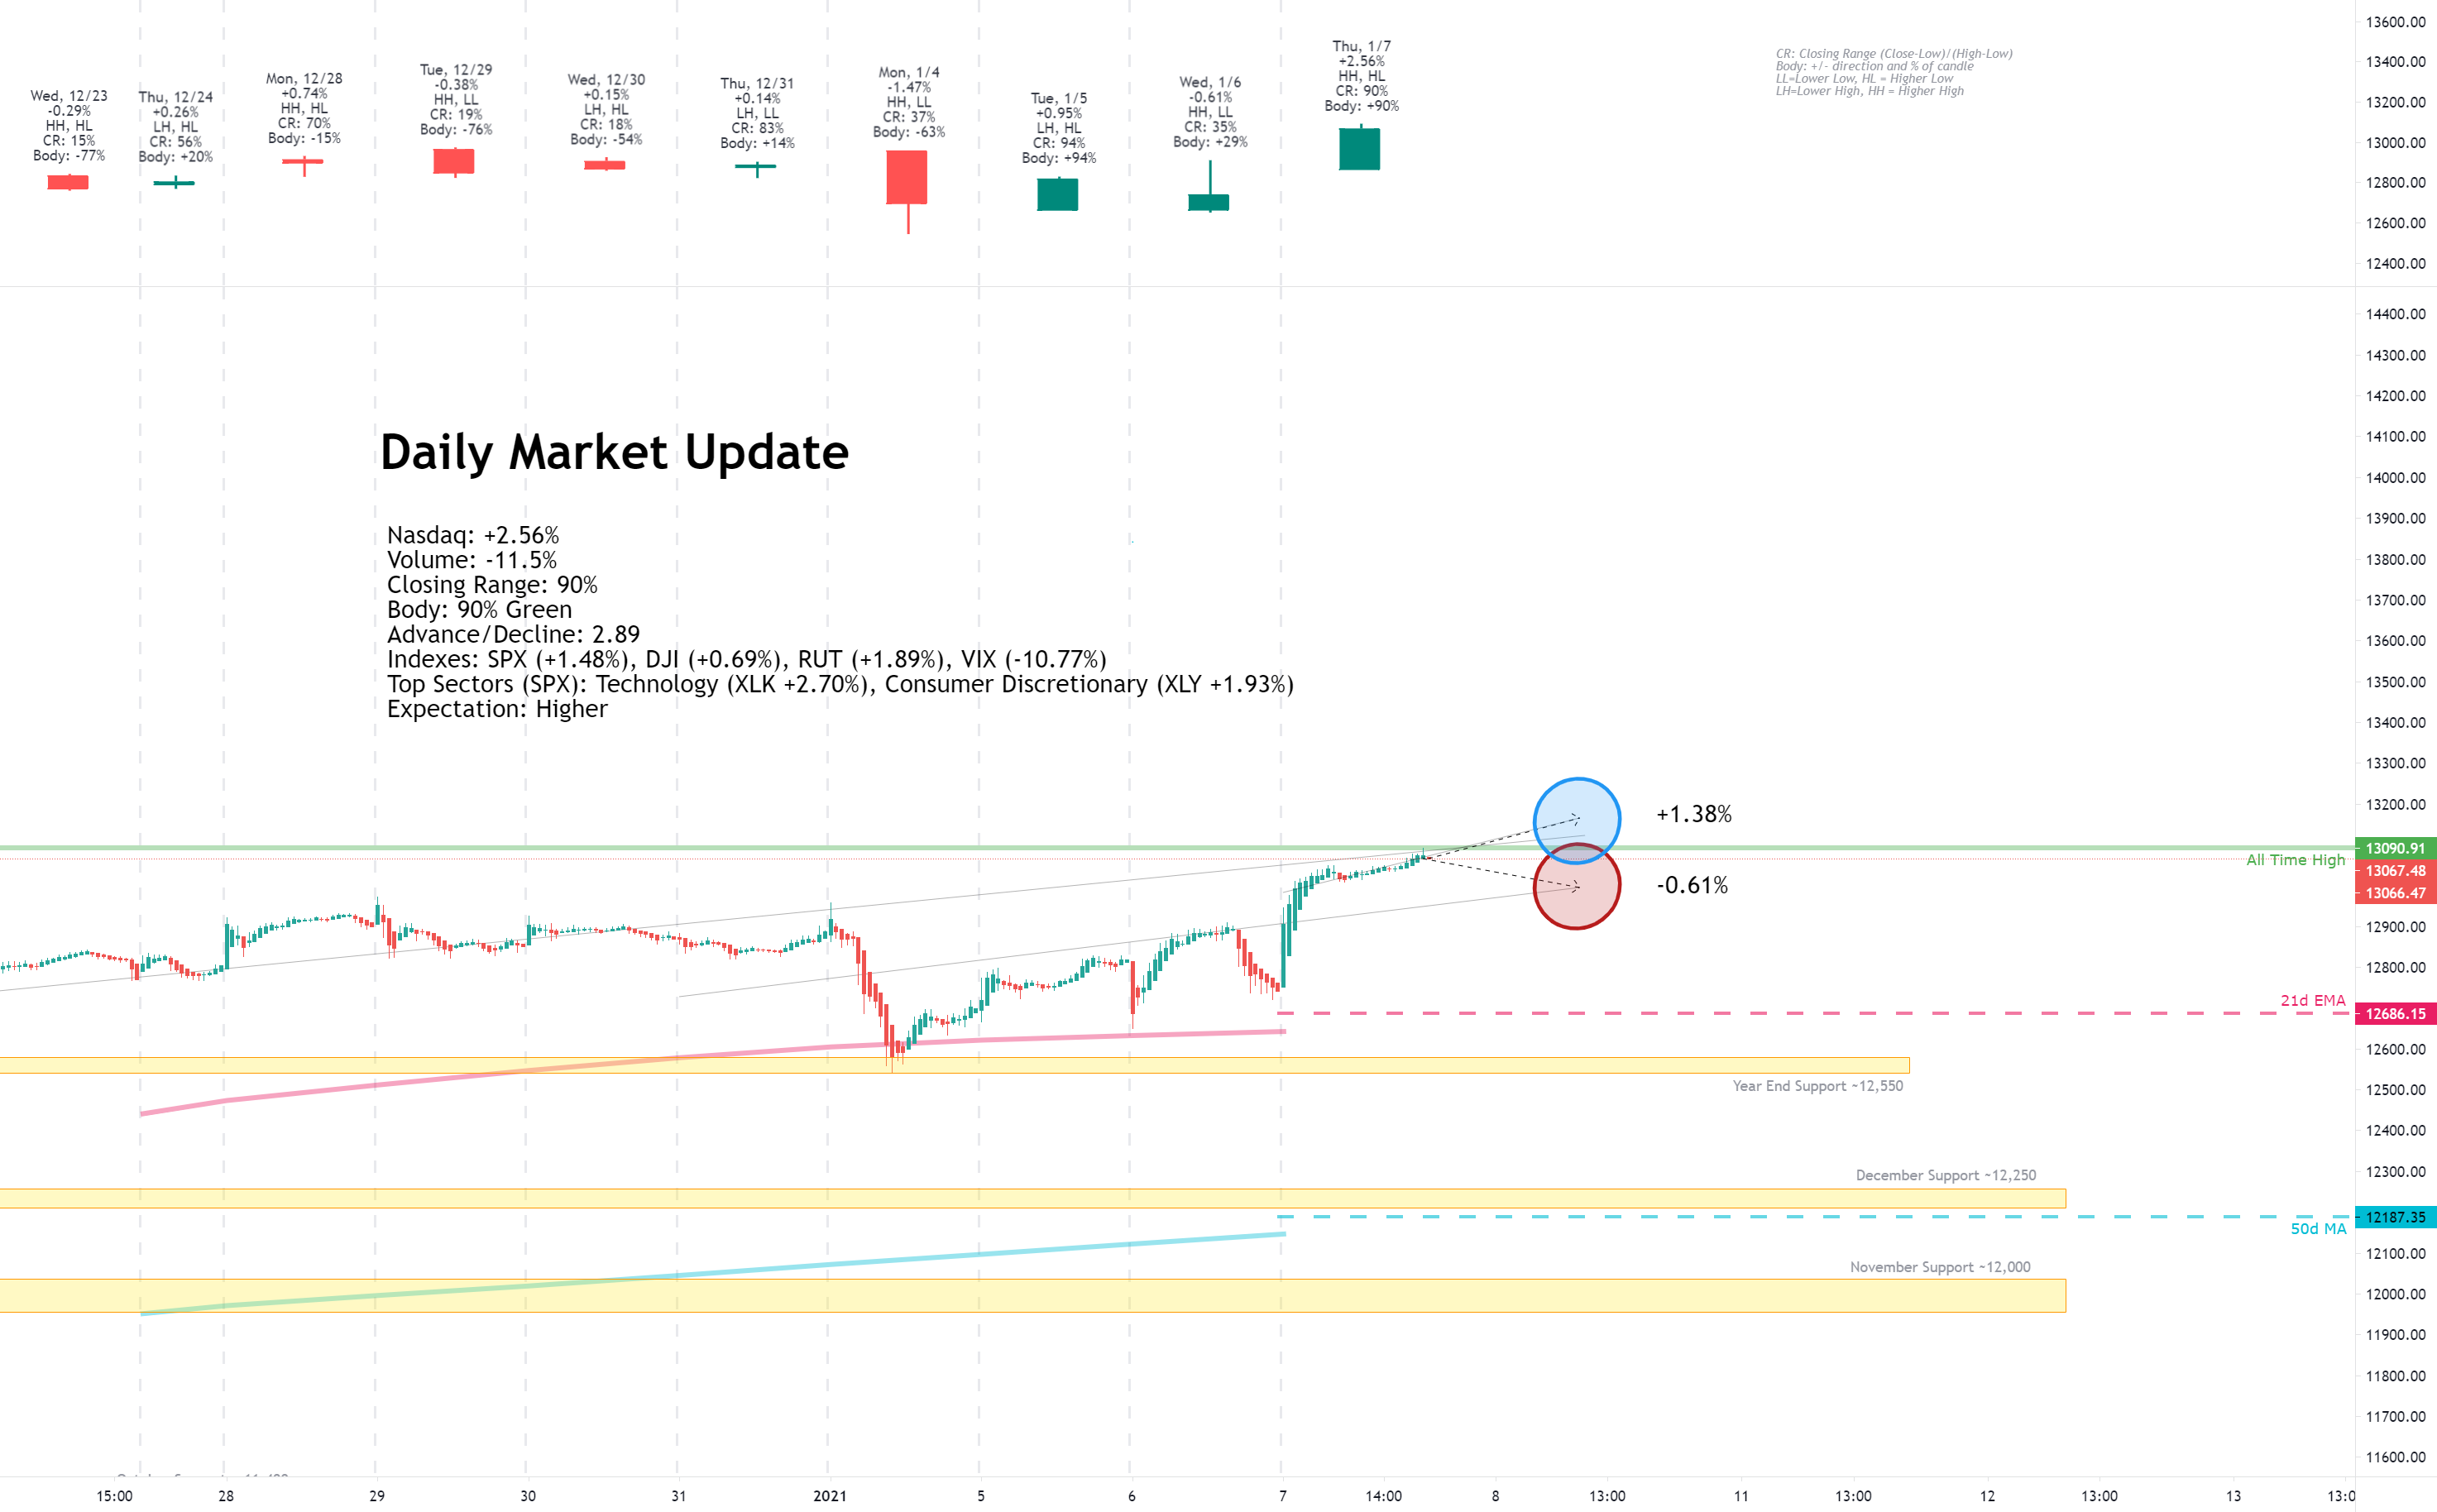
Thursday, January 7, 2021
Ain't no telling, baby
When you will see me again, but I pray
It will be tomorrow
Facts: +2.56%, Volume lower, Closing range: 90%, Body: 90%
Good: Everything, bullish candle following the inverted hammer
Bad: Nothing
Highs/Lows: Higher high, higher low
Candle: No lower wick, very small upper wick, thick green body
Expectation: Higher
Finally, everything is finalized and seems we can put the tumultuous election behind us. On top of that, jobless claims data was better than expected and economic activity represented by the Purchasing Managers Index was very positive. The markets responded with a huge gain and new all-time highs among the indexes.
The Nasdaq closed with a +2.56% on lower volume, and with a very bullish candle. The closing range of 90% was over a 90% body, resulting in zero lower wick as the index never revisited the low from open. There were nearly three advancing stocks for every declining stock. Over 300 Nasdaq stocks made new highs.
-=x=-=x=-=x=-=x=-=x=-=x=-=x=-
Friday, January 8, 2021
Might even raise a little sand
Facts: +1.03%, Volume higher, Closing range: 96%, Body: 24%
Good: Bulls win the day, despite selling pressure
Bad: Mid-day sell-off
Highs/Lows: Higher high, higher low
Candle: Smallish green body in upper part of candle, long lower wick
Expectation: Higher
It was a wild ride for traders today as a Democratic senator seemed to state he'd block new stimulus and then later say he's still considering his decision. That resulted in a mid-day sell-off and looked like the bears would win, but then the Nasdaq turned and closed at new all-time highs.
The index closed the day with a +1.03% gain on higher volume. The closing range of 96% and 24% green body over a long lower wick represent the mid-day selling pressure that was eventually overcome by the bulls. There were about the same number of advancing stocks as declining stocks. 275 new highs is less than the previous day, but still a very large number.
-=x=-=x=-=x=-=x=-=x=-=x=-=x=-
The Meaning of Life (View on the Week)
The first week of 2021 for the markets was filled with twists and turns but ended with gains across all the major indexes. The Nasdaq ended the week with a +2.43% gain; not a bad start to the year. Volume was higher as investors came back from the holidays. The index has a weekly closing range of 99% with a green body of 36.7% at the top of the candle.
The Russell 2000 (RUT) was back on top of the major indexes, gaining another +5.91% for the week. The S&P 500 gained +1.83% while the Dow Jones Industrial average gained +1.61%. The VIX closed down -5.23% after spiking at the beginning of the week.
The week started on a bearish note as investors came back from the holidays fearing the worst for the pandemic. The UK had announced new lockdowns to control a more contagious mutant of the COVID-19 virus. The index dropped below the 21d EMA, a key indicator line that can show a break down in support. Things recovered in the afternoon, but not nearly enough to look bullish. The VIX volatility index spiked more than 20% before receding.
Tuesday was a positive expectation breaker. There was positive news in the manufacturing purchase data that shows economic activity is picking up. The indexes had bullish inside days.
Wednesday was the pivotal day of the week. The market aside, the day will be written into American history. Although the day was a loss for markets, it would prove pivotal to the upside for the week. We can hope it will also be pivotal to the upside for United States democracy, and most importantly it's citizens.
For the Nasdaq, the day would start with selling as the Georgia run-off elections resulted in Democrats taking control of the senate and a blue wave government was now confirmed. However, investors quickly shrugged off the news and began to buy back discounted tech stocks. That would halt in the afternoon when a siege on the US Capitol hit the news. As rioters broke thru the capitol doors, causing evacuations of politicians and their staff, markets quickly began selling.
It really looked dismal for stocks, but it was worth taking a step back. It could have been a lot worse, and what you see in the candle is an inverted hammer. An inverted hammer signals the selling pressure, but that buyers came in to hold the index above the day's lows. That candle is a signal, but only confirmed if the following days were bullish. And Thursday and Friday brought us the confirmation.
Thursday would be a big day for markets. Brave members of the US Congress, on both sides of the aisle, reconvened late Wednesday and worked through the night to count and confirm the electoral votes. Friday showed there was still a bit of nervousness when one Democratic senator seemed to oppose the stimulus, causing stocks to briefly sell off. However, he corrected his stance later in the day and markets ended the week at new all-time highs.
The weekly chart shows the continued strong momentum in the Nasdaq, despite the pressures on big tech that may come from a Democratic controlled government. The average closing range over the past 10 weeks is 75% as the index has consistently either a higher high or a higher low, both positive signs of support and growth. Volume on positive weeks is much higher than volume on negative weeks. Accumulation continues to outweigh distribution.
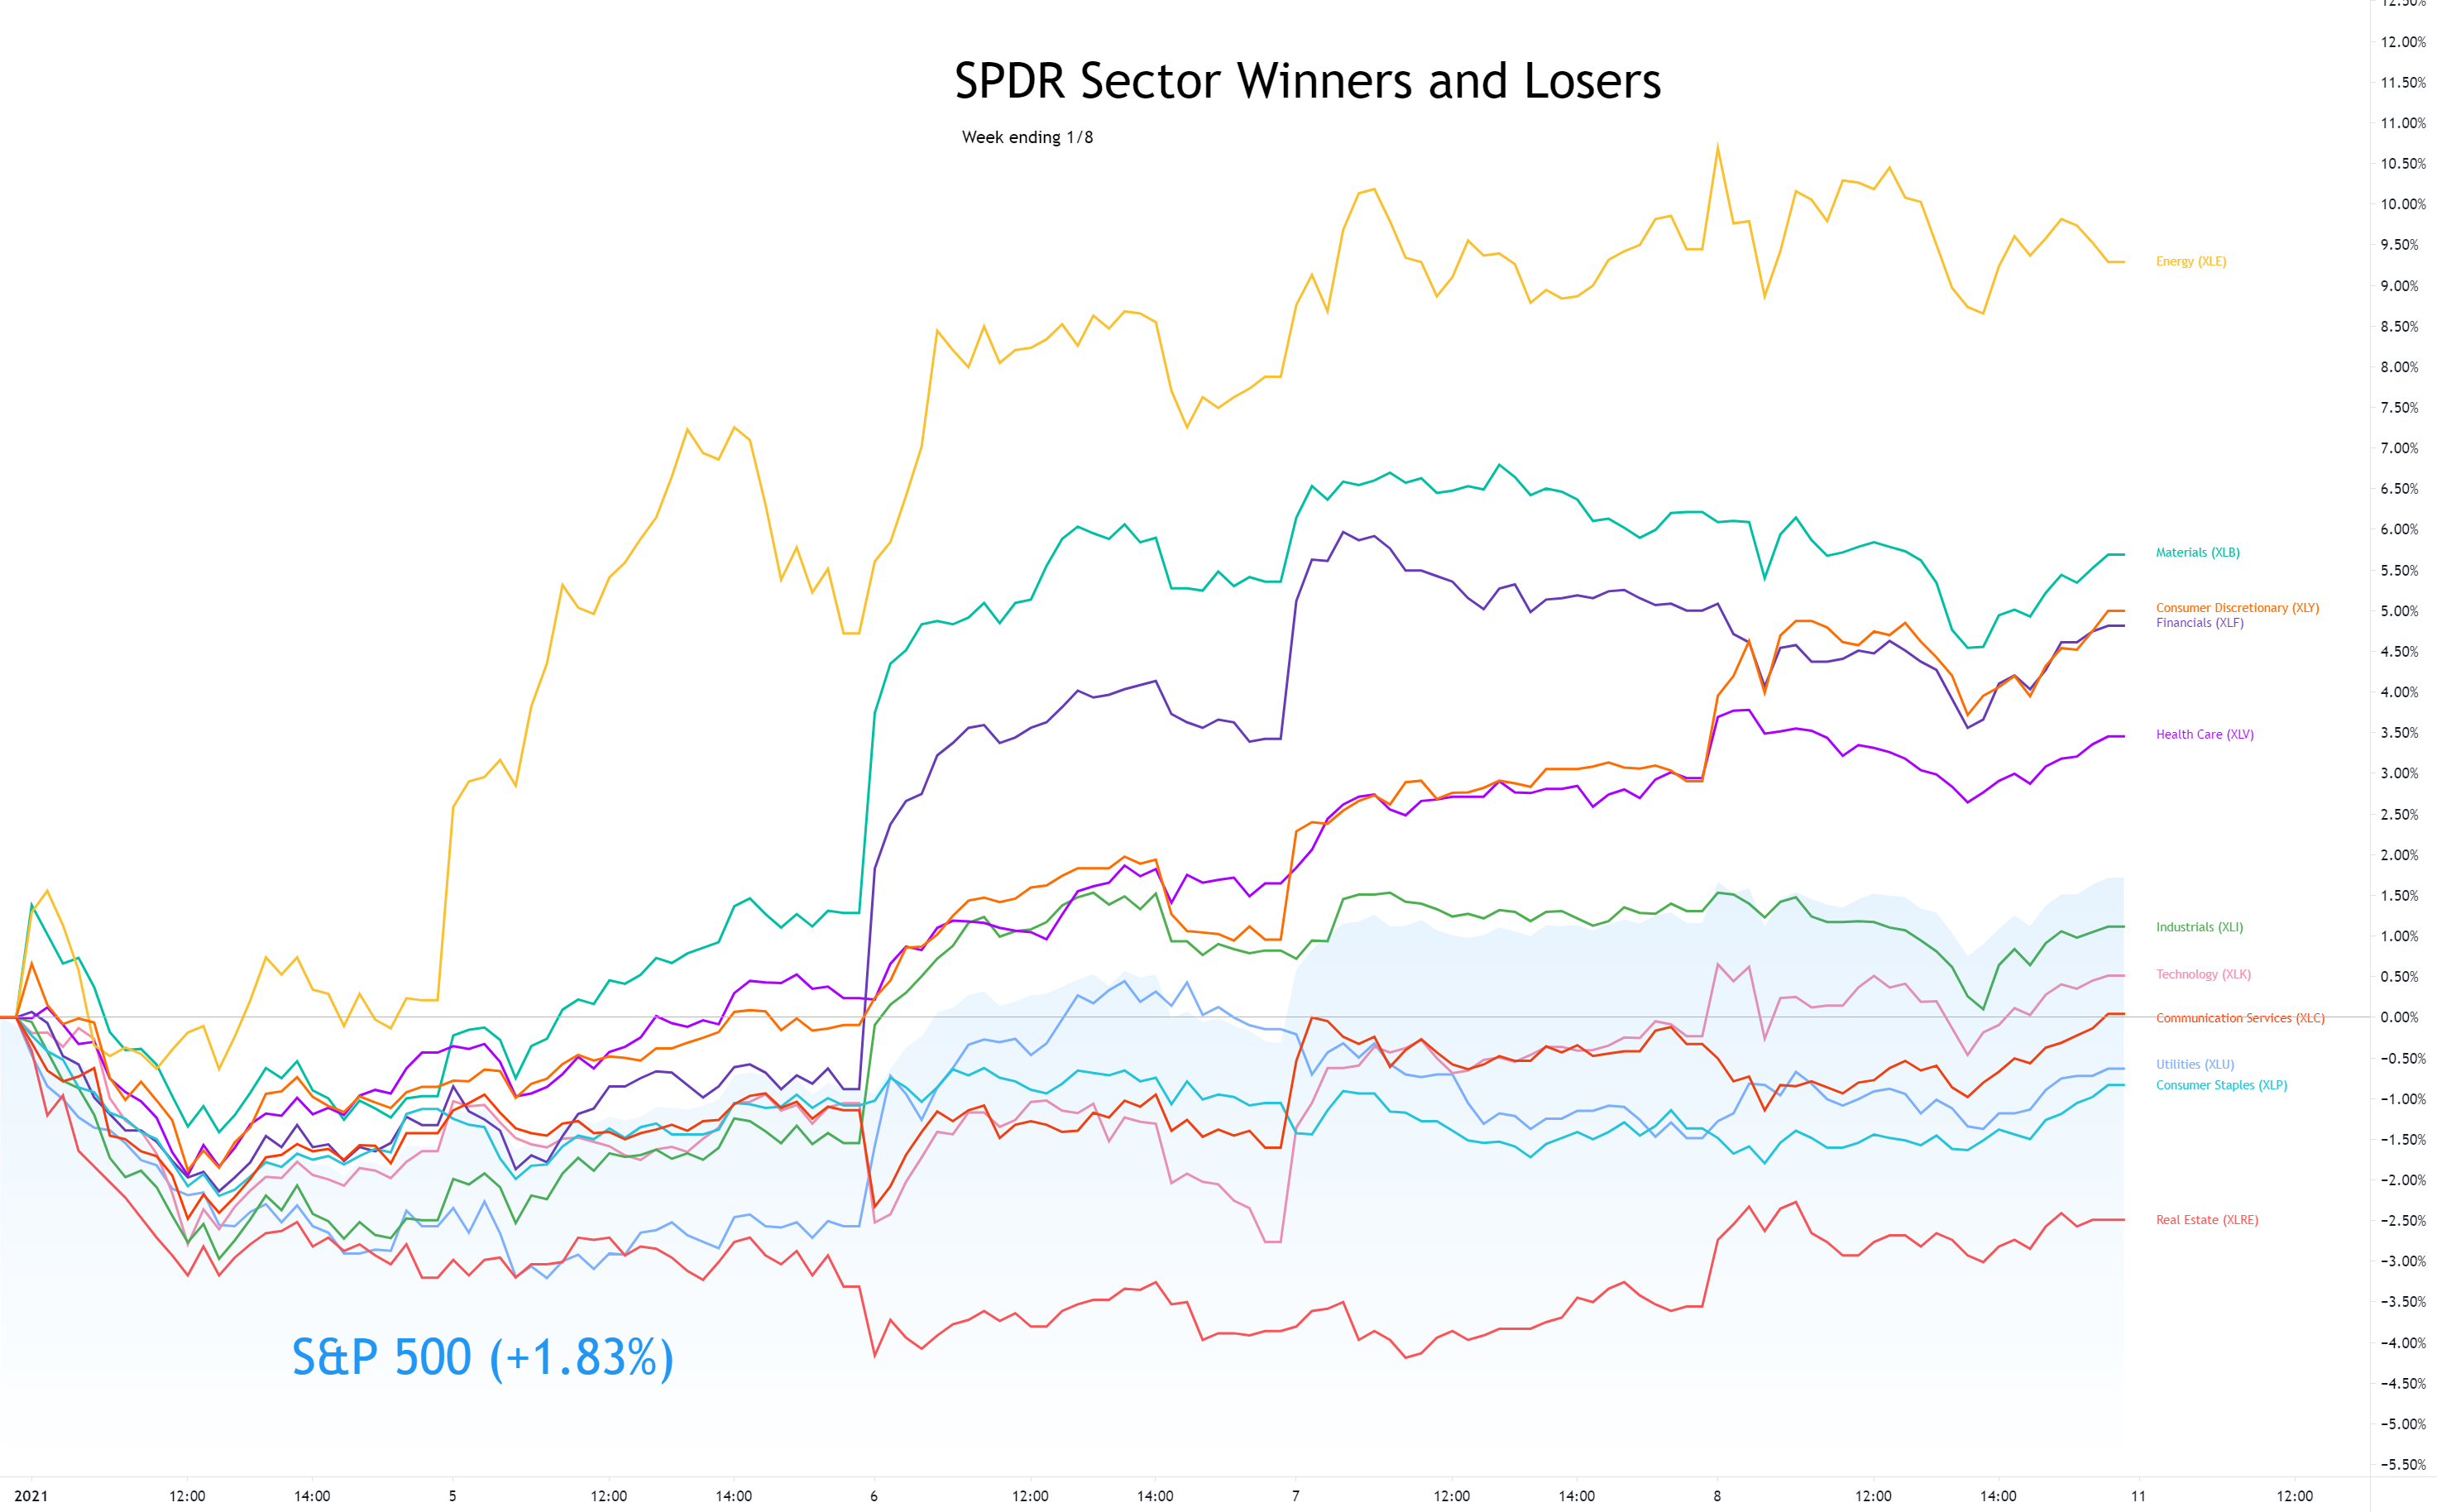
Energy ( XLE ) finds itself back at the top of the sector list for the first week of 2021. It's not something you might expect as the blue wave hit US politics. The democratic clean energy platform doesn't bode well for traditional energy stocks. However, crude oil is over $50 a barrel for the first time since April after Saudi Arabia surprisingly cut output.
The blue wave did have some expected sector impact this week. After the Georgia run-off results showed Democrats would take control of the senate, US Treasury Bond yields took off as investors expect more stimulus that would further impact the US Dollar . That caused Financials ( XLF ), especially big banks, to have big gains on Wednesday and Thursday.
Materials ( XLB ) benefited from the blue wave news, as we can expect big investments in US infrastructure with the new administration.
Industrials ( XLI ) also had a boost on Wednesday, with some benefit from infrastructure spend, but also several segments like airlines likely to benefit from further stimulus. However, Industrials did not continue the rise and ended the week behind the S&P 500 .
Consumer Discretionary ( XLY ) got a boost on Friday, perhaps from higher than expected Consumer credit numbers on top of the promise of new stimulus. Quite a few people had a good Christmas it seems.
At the bottom of the list is Real Estate ( XLRE ) which is likely to suffer in the bottom line from the higher interest rates.
Technology ( XLK ) had the expected negative reaction to the blue wave on Wednesday but regained from losses on Thursday and Friday to end the week just behind Industrials .
Also notable is Utilities ( XLU ) which lost for the week, but had gains on Friday as a defensive move heading into a likely emotion filled weekend for the United States.
US Treasury Bond Yields rose significantly for the week as investors reacted to the Democrats winning the senate. Democrats are likely to pass much more stimulus which will further drive investors out of bonds and into other asset classes. The spread between US 10y and US 2y bond yields widened. This had a positive impact on the Financials sector as big banks will benefit from the higher interest rates driven by treasury bond yields.
Prices for corporate bonds (HYG) rose while the prices for short-term treasury bonds (IEI) dropped. This represents investors' confidence in corporations ability to pay back debt. That is important since many companies incurred larger than normal debt to weather the pandemic. If companies begin to default on loans, you can bet these bonds will sell-off before we know there's a problem.
The US Dollar (DXY) rose +0.19% for the week.
The put/call ratio (PCCE) ended the week at 0.563. That is an overly bullish level, but not as low as we've seen preceding recent pullbacks in the market. A contrarian indicator, when the put/call ratio is below 0.7, it signals overly bullish sentiment which typically proceeds a pullback in the market. The indicator was at 0.458 just before the September correction and it was at 0.489 just before the short October correction.
Silver (SILVER) was down -3.54% and Gold (GOLD) was down -2.61% as investors moved from the safe-haven back into assets that will benefit from new stimulus. Crude Oil futures was up +7.80% after the surprise cut back in output from Saudi Arabia.
Timber (WOOD) was up +3.97%. Copper (COPPER!1) rose +4.59% while Aluminum (ALI1!) rose +1.62%. These increases align with expectations that Democrats will increase spend on infrastructure. It's consistent also with the gains in the Materials and Industrials sectors.
It's important to keep an eye on the four biggest mega-caps and how they react to market changes. Apple (AAPL), Microsoft (MSFT) and Amazon (AMZN) all ended the week with losses, but are trading above the 10w moving average lines. Microsoft and Amazon briefly dipped below the line, but found support and closed the week above. Alphabet (GOOGL) ended the week with gains. It also dropped below the 10w MA line, but found support.
The cannabis industry is certain to benefit from legislature that will more easily pass through congress and be signed by the new administration. Stocks (including the MJ ETF) gapped up on Wednesday.
Clean Energy, Electric Vehicles, Financials and Materials were among other stocks that also soared on Wednesday.
-=x=-=x=-=x=-=x=-=x=-=x=-=x=-
The Week Ahead
Next week will bring several economic updates. JOLT Job Openings (Nov) on Tuesday and updates on Initial Jobless Claims on Thursday will provide more insight into the jobs market. Consumer price index data and Producer price index data will show any impact the weakened US Dollar is having on inflation. Friday will also bring an update on core retail sales data for December.
Traders will closely listen to Jerome Powell who is scheduled to speak on Thursday at 12:30p.
The frequency and relative importance of earnings reports will start to pick up next week. Carnival Corp (CCL) and Delta Airlines (DAL) will be among companies reporting who were impacted by the pandemic. Blackrock (BLK), Citigroup (C), JPMorgan Chase (JPM) and Wells Fargo (WFC) will report later in the week.
-=x=-=x=-=x=-=x=-=x=-=x=-=x=-
The Bullish Side
This week tested the market. We've been watching for a catalyst for the market to lose support and drop below key support areas. The riots on the US capitol could have been that catalyst. But it wasn't. Even as seller pressure increased on Wednesday, buyers came in and showed this market is not yet ready to become bearish. The inverted hammer on Wednesday was an indicator of support holding and was confirmed with the bullish days on Thursday and Friday.
30y and 10y US Treasury Bond yields rose as investors sold off the safe-haven instrument in favor of other asset classes. That was in anticipation of further stimulus coming from a Democratic controlled congress. That anticipation was confirmed when investors were briefly shaken on Friday by a Democratic senator stating he might not approve the stimulus, reversing some of the actions taken earlier in the week. The senator clarified the comment as he was still deciding and that brought investors back to equities.
So the markets continue to rise. The index has closed above the 21d EMA for 45 days. That's 10 weeks of rally, that hasn't yet shown signs of backing down. Certainly there will be pullbacks like we saw on Monday, but we have to follow the market vs worry about an eminent crash that may be months away...
-=x=-=x=-=x=-=x=-=x=-=x=-=x=-
The Bearish Side
…or it could be tomorrow. Investor sentiment continues to remain overly bullish with NAAIM exposure index heading back to highs. The Put/Call ratio remains below 0.600 The CNN Fear & Greed index is rising again. All of that could be the kind of overly bullish sentiment that precedes a much more severe pullback.
The pandemic continues to worsen even as vaccines are becoming more and more available around the world. New lockdowns seem to be popping up with frequency.
But the biggest worry for the coming weeks is the transition of power between administrations. The riots at the US Capitol have seemed to only fuel more verbal attacks from the right and the left. If those turn into more than verbal attacks, it could be that start of a very dark time in US history. It seems ominous and unbelievable, but I think the point here is that investors will be on nerves and any hint of worsening conditions could be a catalyst.
-=x=-=x=-=x=-=x=-=x=-=x=-=x=-
Key Nasdaq Levels to Watch
There are several key levels in the Nasdaq to keep an eye out for and respond accordingly. First on the positive side:
On the downside, there are several key levels to raise caution flags:
-=x=-=x=-=x=-=x=-=x=-=x=-=x=-
Wrap-up
It was a rough week. Lots going on. The market survived it and that’s good news for investors. Looking forward, it will be good to remain cautious while not disengaging too much. More rally could be in front of us.
With all the changes, take some time to evaluate your stocks. Look at weekly action vs daily action. Rank the stocks and determine where some additions and some trimming should be based on the changes this week. Most of all, keep in mind your risk plans and update stops as necessary.
Good luck, stay healthy and trade safe!
I do occasionally have some errors or typos and will correct them in my blog or in the comments on TradingView. I do not have an editor and do this in my free time.
If you find this helpful, please let me know in the comments. I am also more than happy to add new perspectives and data points if you have ideas.
The structure is the following:
- A recap of the daily updates that I do here on TradingView.
- The Meaning of Life, a view on the past week
- What's coming in the next week
- The Bullish View, The Bearish View
- Key index levels to watch out for
- Wrap-up
If you have been following my daily updates, you can skip down to the “The Meaning of Life”. If not, then this first part is a great play-by-play recap for the week. Click the original charts for more detail each day.
-=x=-=x=-=x=-=x=-=x=-=x=-=x=-
Monday, January 4, 2021
Lately things, they don't seem the same

Facts: -1.47%, Volume higher, Closing range: 37%, Body: 63%
Good: Held support around 12,550, some recovery off lows
Bad: Thick red body, no upper wick
Highs/Lows: Higher high, lower low
Candle: Bearish engulfing candle with thick body over long lower wick
Expectation: Sideways or Lower
It was not a great start to 2021 with the equity markets selling off significantly throughout the day after making morning highs. The Nasdaq nearly reach its all-time high before selling off sharply in the morning. Recovery in the afternoon was not nearly enough to be seen as a positive. The index closed down -1.45% with a closing range of 37% and a thick red body of 63%. The higher high and lower low than the previous day represents a bearish engulfing candle that can indicate bearish sentiment in the market. There were more declining stocks than advancing stocks.
-=x=-=x=-=x=-=x=-=x=-=x=-=x=-
Tuesday, January 5, 2021
There must be some kind of way outta here
Facts: +0.95%, Volume higher, Closing range: 94%, Body: 94%
Good: Solid day of gains, no lower wick
Bad: Nothing
Highs/Lows: Lower high, higher low
Candle: Inside day, bullish green body with no lower wick and tiny upper wick
Expectation: Sideways or Higher
The Nasdaq followed yesterday's bearish session with a bullish rebound today. There is still work to do to get back to all-time highs, but the gains were steady throughout the day as the index never revisited the morning low. The index closed the day with a +0.95% gain on higher volume, closing range of 94% and a thick green body of 94%. The lower wick doesn't exist and the upper wick is very tiny. More than two stocks advanced for every declining stock.
-=x=-=x=-=x=-=x=-=x=-=x=-=x=-
Wednesday, January 6, 2021
Bold as Love

Facts: -0.61%, Volume higher, Closing range: 35%, Body: 29%
Good: Stayed above opening low, held support at around yesterday's low
Bad: Sell-off in late afternoon
Highs/Lows: Higher high, lower low
Candle: Inverted hammer that signals buyers held support despite selling pressure
Expectation: Sideways or Higher
It was a wild day for the markets as unbelievable events unfolded in the US capitol. The Georgia run-off elections resulted in Democrats taking control of the Senate, realizing the blue wave that was original anticipated with the November elections. The Nasdaq shook off the initial rotation and rose to gains by mid-afternoon, but would sell-off as rioters stormed the US Capitol in protest of election outcomes. The index closed -0.61% on higher volume with a closing range of 35% and a body of 29%. More stocks advanced than declined.
-=x=-=x=-=x=-=x=-=x=-=x=-=x=-
Thursday, January 7, 2021
Ain't no telling, baby
When you will see me again, but I pray
It will be tomorrow
Facts: +2.56%, Volume lower, Closing range: 90%, Body: 90%
Good: Everything, bullish candle following the inverted hammer
Bad: Nothing
Highs/Lows: Higher high, higher low
Candle: No lower wick, very small upper wick, thick green body
Expectation: Higher
Finally, everything is finalized and seems we can put the tumultuous election behind us. On top of that, jobless claims data was better than expected and economic activity represented by the Purchasing Managers Index was very positive. The markets responded with a huge gain and new all-time highs among the indexes.
The Nasdaq closed with a +2.56% on lower volume, and with a very bullish candle. The closing range of 90% was over a 90% body, resulting in zero lower wick as the index never revisited the low from open. There were nearly three advancing stocks for every declining stock. Over 300 Nasdaq stocks made new highs.
-=x=-=x=-=x=-=x=-=x=-=x=-=x=-
Friday, January 8, 2021
Might even raise a little sand

Facts: +1.03%, Volume higher, Closing range: 96%, Body: 24%
Good: Bulls win the day, despite selling pressure
Bad: Mid-day sell-off
Highs/Lows: Higher high, higher low
Candle: Smallish green body in upper part of candle, long lower wick
Expectation: Higher
It was a wild ride for traders today as a Democratic senator seemed to state he'd block new stimulus and then later say he's still considering his decision. That resulted in a mid-day sell-off and looked like the bears would win, but then the Nasdaq turned and closed at new all-time highs.
The index closed the day with a +1.03% gain on higher volume. The closing range of 96% and 24% green body over a long lower wick represent the mid-day selling pressure that was eventually overcome by the bulls. There were about the same number of advancing stocks as declining stocks. 275 new highs is less than the previous day, but still a very large number.
-=x=-=x=-=x=-=x=-=x=-=x=-=x=-
The Meaning of Life (View on the Week)
The first week of 2021 for the markets was filled with twists and turns but ended with gains across all the major indexes. The Nasdaq ended the week with a +2.43% gain; not a bad start to the year. Volume was higher as investors came back from the holidays. The index has a weekly closing range of 99% with a green body of 36.7% at the top of the candle.
The Russell 2000 (RUT) was back on top of the major indexes, gaining another +5.91% for the week. The S&P 500 gained +1.83% while the Dow Jones Industrial average gained +1.61%. The VIX closed down -5.23% after spiking at the beginning of the week.
The week started on a bearish note as investors came back from the holidays fearing the worst for the pandemic. The UK had announced new lockdowns to control a more contagious mutant of the COVID-19 virus. The index dropped below the 21d EMA, a key indicator line that can show a break down in support. Things recovered in the afternoon, but not nearly enough to look bullish. The VIX volatility index spiked more than 20% before receding.
Tuesday was a positive expectation breaker. There was positive news in the manufacturing purchase data that shows economic activity is picking up. The indexes had bullish inside days.
Wednesday was the pivotal day of the week. The market aside, the day will be written into American history. Although the day was a loss for markets, it would prove pivotal to the upside for the week. We can hope it will also be pivotal to the upside for United States democracy, and most importantly it's citizens.
For the Nasdaq, the day would start with selling as the Georgia run-off elections resulted in Democrats taking control of the senate and a blue wave government was now confirmed. However, investors quickly shrugged off the news and began to buy back discounted tech stocks. That would halt in the afternoon when a siege on the US Capitol hit the news. As rioters broke thru the capitol doors, causing evacuations of politicians and their staff, markets quickly began selling.
It really looked dismal for stocks, but it was worth taking a step back. It could have been a lot worse, and what you see in the candle is an inverted hammer. An inverted hammer signals the selling pressure, but that buyers came in to hold the index above the day's lows. That candle is a signal, but only confirmed if the following days were bullish. And Thursday and Friday brought us the confirmation.
Thursday would be a big day for markets. Brave members of the US Congress, on both sides of the aisle, reconvened late Wednesday and worked through the night to count and confirm the electoral votes. Friday showed there was still a bit of nervousness when one Democratic senator seemed to oppose the stimulus, causing stocks to briefly sell off. However, he corrected his stance later in the day and markets ended the week at new all-time highs.
The weekly chart shows the continued strong momentum in the Nasdaq, despite the pressures on big tech that may come from a Democratic controlled government. The average closing range over the past 10 weeks is 75% as the index has consistently either a higher high or a higher low, both positive signs of support and growth. Volume on positive weeks is much higher than volume on negative weeks. Accumulation continues to outweigh distribution.
Energy ( XLE ) finds itself back at the top of the sector list for the first week of 2021. It's not something you might expect as the blue wave hit US politics. The democratic clean energy platform doesn't bode well for traditional energy stocks. However, crude oil is over $50 a barrel for the first time since April after Saudi Arabia surprisingly cut output.
The blue wave did have some expected sector impact this week. After the Georgia run-off results showed Democrats would take control of the senate, US Treasury Bond yields took off as investors expect more stimulus that would further impact the US Dollar . That caused Financials ( XLF ), especially big banks, to have big gains on Wednesday and Thursday.
Materials ( XLB ) benefited from the blue wave news, as we can expect big investments in US infrastructure with the new administration.
Industrials ( XLI ) also had a boost on Wednesday, with some benefit from infrastructure spend, but also several segments like airlines likely to benefit from further stimulus. However, Industrials did not continue the rise and ended the week behind the S&P 500 .
Consumer Discretionary ( XLY ) got a boost on Friday, perhaps from higher than expected Consumer credit numbers on top of the promise of new stimulus. Quite a few people had a good Christmas it seems.
At the bottom of the list is Real Estate ( XLRE ) which is likely to suffer in the bottom line from the higher interest rates.
Technology ( XLK ) had the expected negative reaction to the blue wave on Wednesday but regained from losses on Thursday and Friday to end the week just behind Industrials .
Also notable is Utilities ( XLU ) which lost for the week, but had gains on Friday as a defensive move heading into a likely emotion filled weekend for the United States.
US Treasury Bond Yields rose significantly for the week as investors reacted to the Democrats winning the senate. Democrats are likely to pass much more stimulus which will further drive investors out of bonds and into other asset classes. The spread between US 10y and US 2y bond yields widened. This had a positive impact on the Financials sector as big banks will benefit from the higher interest rates driven by treasury bond yields.
Prices for corporate bonds (HYG) rose while the prices for short-term treasury bonds (IEI) dropped. This represents investors' confidence in corporations ability to pay back debt. That is important since many companies incurred larger than normal debt to weather the pandemic. If companies begin to default on loans, you can bet these bonds will sell-off before we know there's a problem.
The US Dollar (DXY) rose +0.19% for the week.
The put/call ratio (PCCE) ended the week at 0.563. That is an overly bullish level, but not as low as we've seen preceding recent pullbacks in the market. A contrarian indicator, when the put/call ratio is below 0.7, it signals overly bullish sentiment which typically proceeds a pullback in the market. The indicator was at 0.458 just before the September correction and it was at 0.489 just before the short October correction.
Silver (SILVER) was down -3.54% and Gold (GOLD) was down -2.61% as investors moved from the safe-haven back into assets that will benefit from new stimulus. Crude Oil futures was up +7.80% after the surprise cut back in output from Saudi Arabia.
Timber (WOOD) was up +3.97%. Copper (COPPER!1) rose +4.59% while Aluminum (ALI1!) rose +1.62%. These increases align with expectations that Democrats will increase spend on infrastructure. It's consistent also with the gains in the Materials and Industrials sectors.
It's important to keep an eye on the four biggest mega-caps and how they react to market changes. Apple (AAPL), Microsoft (MSFT) and Amazon (AMZN) all ended the week with losses, but are trading above the 10w moving average lines. Microsoft and Amazon briefly dipped below the line, but found support and closed the week above. Alphabet (GOOGL) ended the week with gains. It also dropped below the 10w MA line, but found support.
The cannabis industry is certain to benefit from legislature that will more easily pass through congress and be signed by the new administration. Stocks (including the MJ ETF) gapped up on Wednesday.
Clean Energy, Electric Vehicles, Financials and Materials were among other stocks that also soared on Wednesday.
-=x=-=x=-=x=-=x=-=x=-=x=-=x=-
The Week Ahead
Next week will bring several economic updates. JOLT Job Openings (Nov) on Tuesday and updates on Initial Jobless Claims on Thursday will provide more insight into the jobs market. Consumer price index data and Producer price index data will show any impact the weakened US Dollar is having on inflation. Friday will also bring an update on core retail sales data for December.
Traders will closely listen to Jerome Powell who is scheduled to speak on Thursday at 12:30p.
The frequency and relative importance of earnings reports will start to pick up next week. Carnival Corp (CCL) and Delta Airlines (DAL) will be among companies reporting who were impacted by the pandemic. Blackrock (BLK), Citigroup (C), JPMorgan Chase (JPM) and Wells Fargo (WFC) will report later in the week.
-=x=-=x=-=x=-=x=-=x=-=x=-=x=-
The Bullish Side
This week tested the market. We've been watching for a catalyst for the market to lose support and drop below key support areas. The riots on the US capitol could have been that catalyst. But it wasn't. Even as seller pressure increased on Wednesday, buyers came in and showed this market is not yet ready to become bearish. The inverted hammer on Wednesday was an indicator of support holding and was confirmed with the bullish days on Thursday and Friday.
30y and 10y US Treasury Bond yields rose as investors sold off the safe-haven instrument in favor of other asset classes. That was in anticipation of further stimulus coming from a Democratic controlled congress. That anticipation was confirmed when investors were briefly shaken on Friday by a Democratic senator stating he might not approve the stimulus, reversing some of the actions taken earlier in the week. The senator clarified the comment as he was still deciding and that brought investors back to equities.
So the markets continue to rise. The index has closed above the 21d EMA for 45 days. That's 10 weeks of rally, that hasn't yet shown signs of backing down. Certainly there will be pullbacks like we saw on Monday, but we have to follow the market vs worry about an eminent crash that may be months away...
-=x=-=x=-=x=-=x=-=x=-=x=-=x=-
The Bearish Side
…or it could be tomorrow. Investor sentiment continues to remain overly bullish with NAAIM exposure index heading back to highs. The Put/Call ratio remains below 0.600 The CNN Fear & Greed index is rising again. All of that could be the kind of overly bullish sentiment that precedes a much more severe pullback.
The pandemic continues to worsen even as vaccines are becoming more and more available around the world. New lockdowns seem to be popping up with frequency.
But the biggest worry for the coming weeks is the transition of power between administrations. The riots at the US Capitol have seemed to only fuel more verbal attacks from the right and the left. If those turn into more than verbal attacks, it could be that start of a very dark time in US history. It seems ominous and unbelievable, but I think the point here is that investors will be on nerves and any hint of worsening conditions could be a catalyst.
-=x=-=x=-=x=-=x=-=x=-=x=-=x=-
Key Nasdaq Levels to Watch
There are several key levels in the Nasdaq to keep an eye out for and respond accordingly. First on the positive side:
- The high of Friday at 13.208.09. It's not far above the close, so I think what we want here is for the index to close above that high early in the week and then stay above that close.
- The index is pausing about every 300-400 points, so expect some resistance around 13,350 - 13,400 area.
On the downside, there are several key levels to raise caution flags:
- 12,733.04 is the 21d EMA. The index tested that line twice last week and was able to close above it each time.
- 12,550 had shown as a support area, helped by the 21d EMA.
- The low of last week is 12,543.24 and is just below the 12,550 support area.
- The support area of 12,250 is the next area. Hopefully, that area will hold the index above that price level.
- The 50d MA is at 12,222.76. That is ~7.4% below Thursday's close. The gap with the 50d MA continues to widen.
- November support area is at 12,000 and a round-number point. A drop to that area would be a certainly correction level.
-=x=-=x=-=x=-=x=-=x=-=x=-=x=-
Wrap-up
It was a rough week. Lots going on. The market survived it and that’s good news for investors. Looking forward, it will be good to remain cautious while not disengaging too much. More rally could be in front of us.
With all the changes, take some time to evaluate your stocks. Look at weekly action vs daily action. Rank the stocks and determine where some additions and some trimming should be based on the changes this week. Most of all, keep in mind your risk plans and update stops as necessary.
Good luck, stay healthy and trade safe!