The Market Week in Review is my weekend homework where I look over what happened in the previous week and what might come in the next week. It helps me evaluate my observations, recognize new data points, and create a plan for possible scenarios in the future.
I do occasionally have some errors or typos and will correct them in my blog or in the comments on TradingView. I do not have an editor and do this in my free time.
If you find this helpful, please let me know in the comments. I am also more than happy to add new perspectives and data points if you have ideas.
The structure is the following:
If you have been following my daily updates, you can skip down to the “The Meaning of Life”. If not, then this first part is a great play-by-play recap for the week. Click the daily charts for more detail on sectors, indexes and market leaders each day.
-=x=-=x=-=x=-=x=-=x=-=x=-=x=-
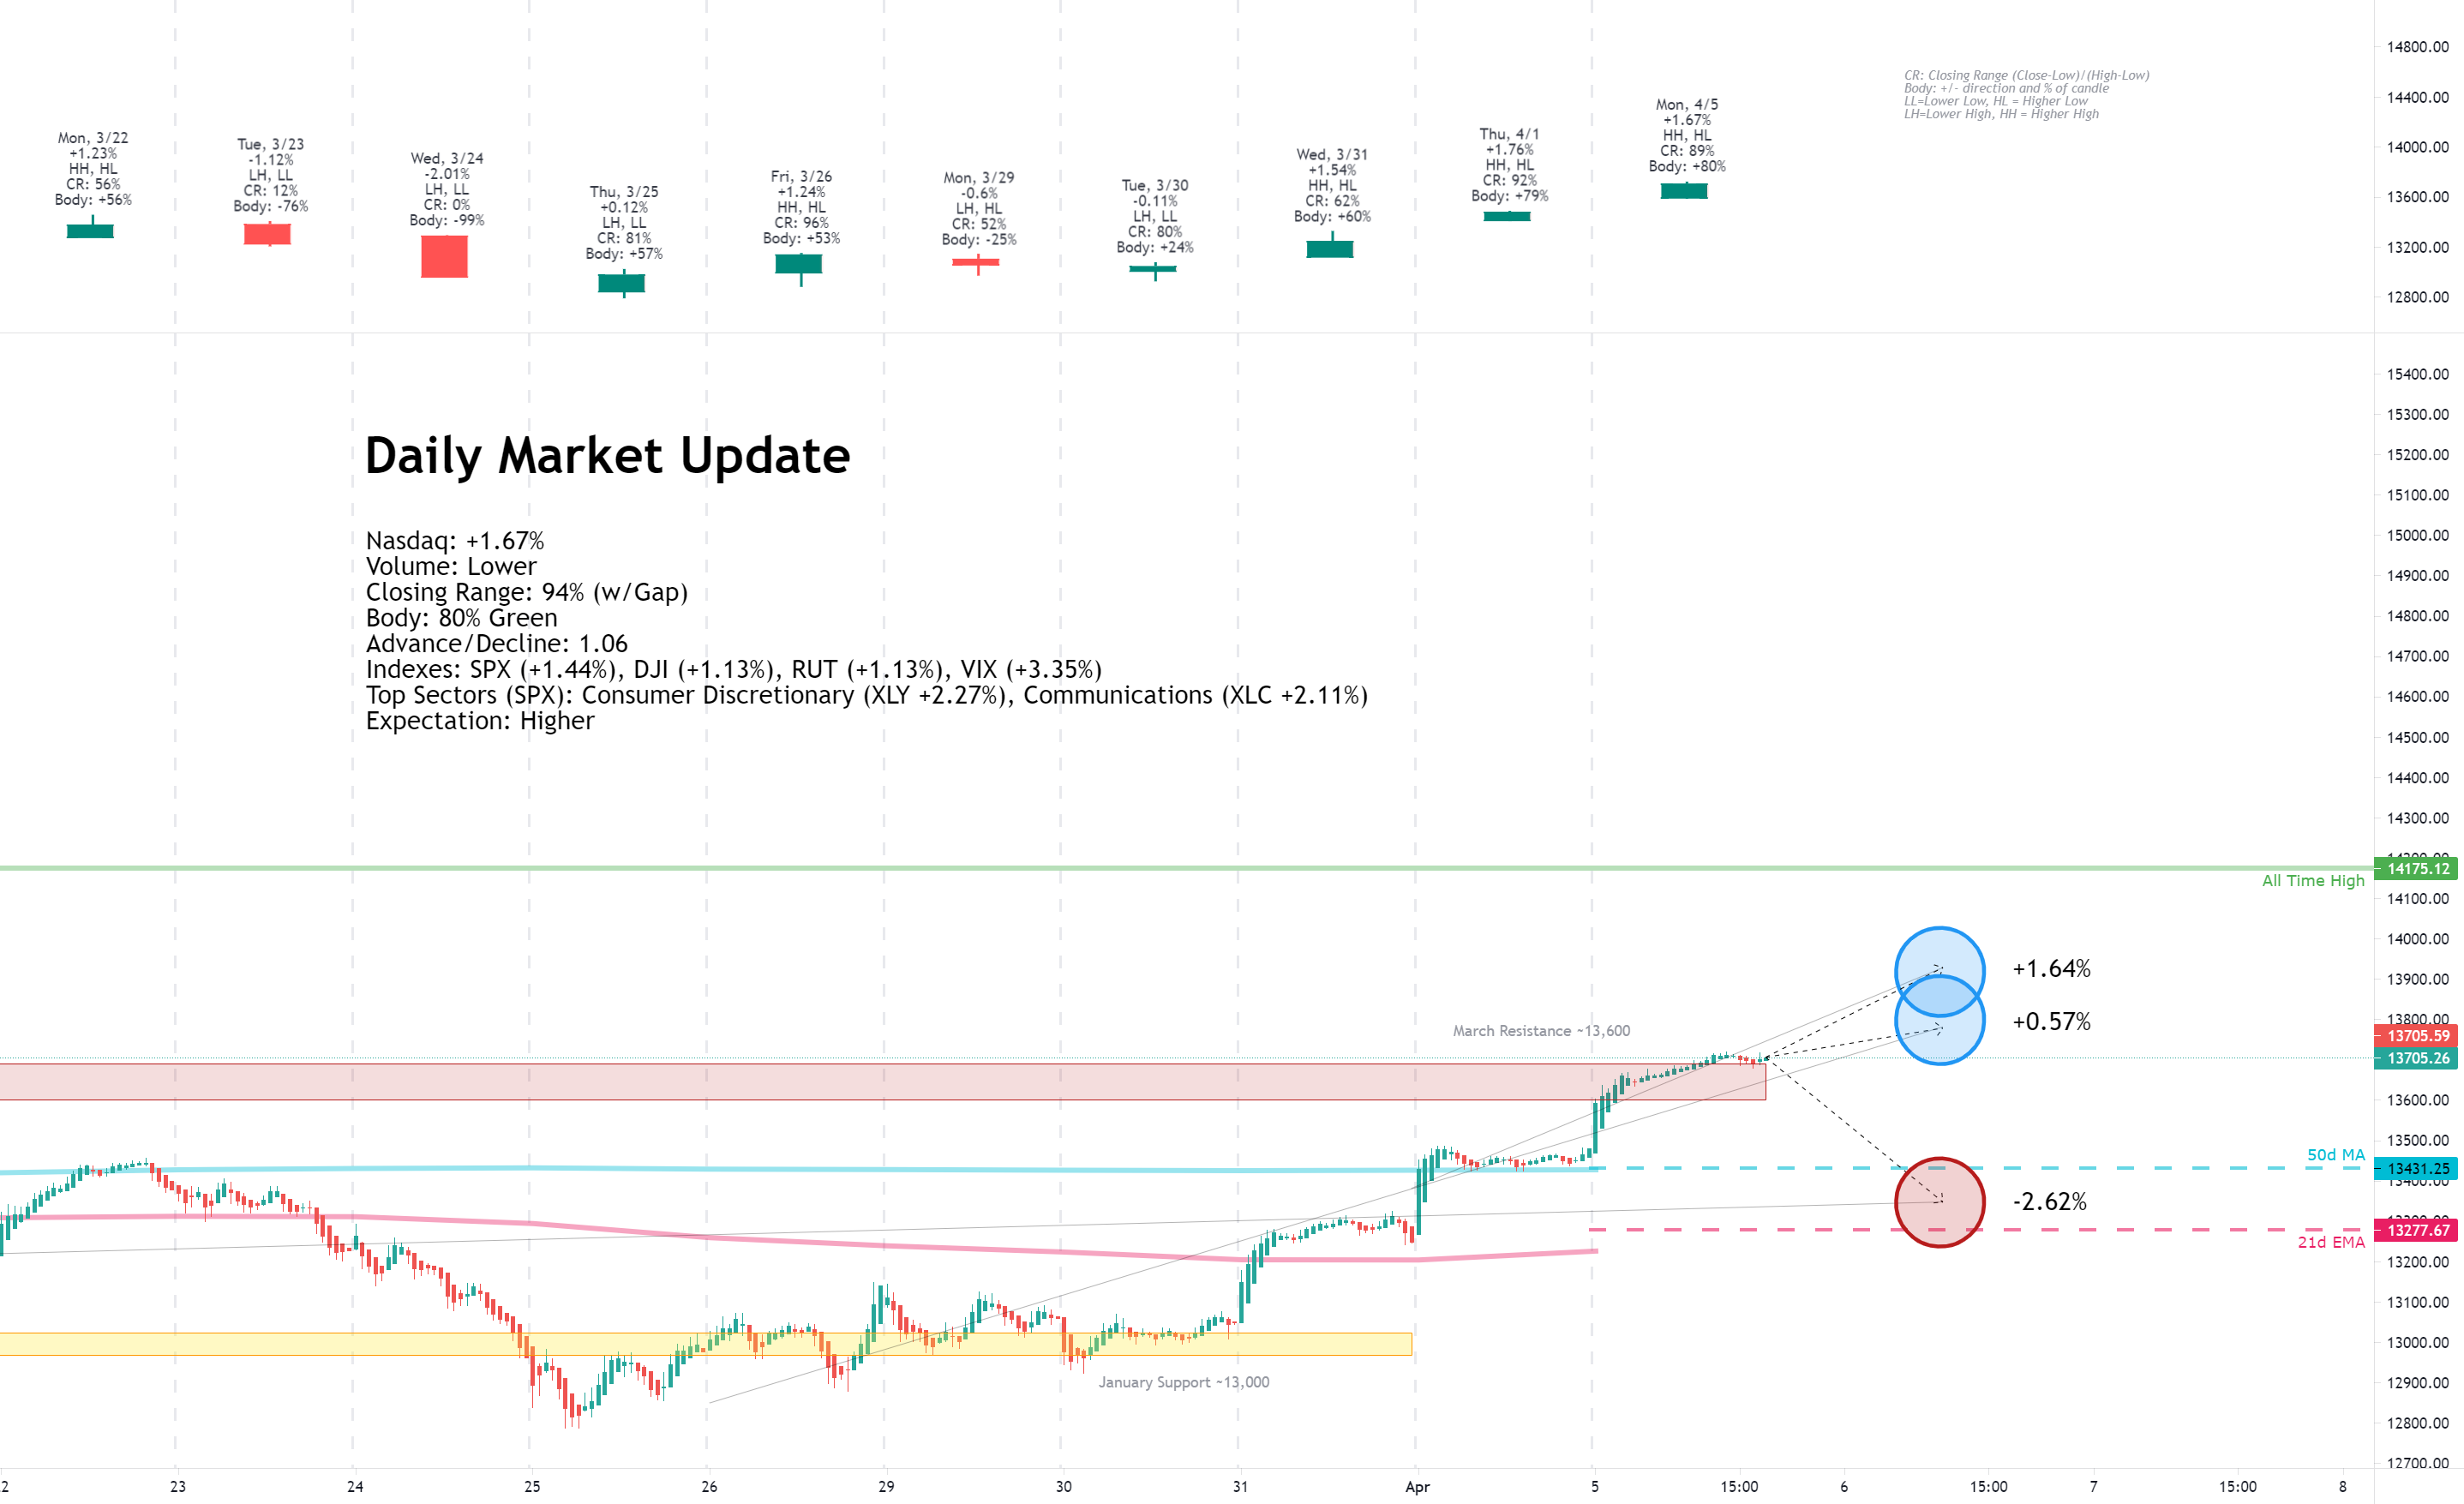
Monday, April 5, 2021

Facts: +1.67%, Volume lower, Closing range: 94% (w/Gap), Body: +80%
Good: Three positive days in a row, above 13,700 confirmed with a quick retest
Bad: Lowering volume
Highs/Lows: Higher high, higher low
Candle: Gap up, mostly green body with a slightly longer upper wick
Advance/Decline: About the same number of advancing as declining stocks.
Indexes: SPX (+1.44%), DJI (+1.13%), RUT (+0.49%), VIX (+3.35%)
Sectors: Consumer Discretionary (XLY +2.27%) and Communications (XLC +2.11%) were top. Energy (XLE -2.39%) was the only declining sector.
Expectation: Higher
The markets set new records on Monday led by gains from the largest public companies in Consumer Discretionary, Communications and Technology. The S&P 500 and Dow Jones Industrial marked new all-time highs with a bullish session that began the day with opening gap ups.
The Nasdaq closed the day with a +1.67% gain on lower volume. The closing range of 94% includes the morning gap-up that led to an 80% green body. A minor fade in the afternoon created a slightly longer upper wick than the lower wick but the higher high and higher low continue a strong uptrend from last week's pivot. There were about the same number of gaining stocks as declining stocks.
-=x=-=x=-=x=-=x=-=x=-=x=-=x=-
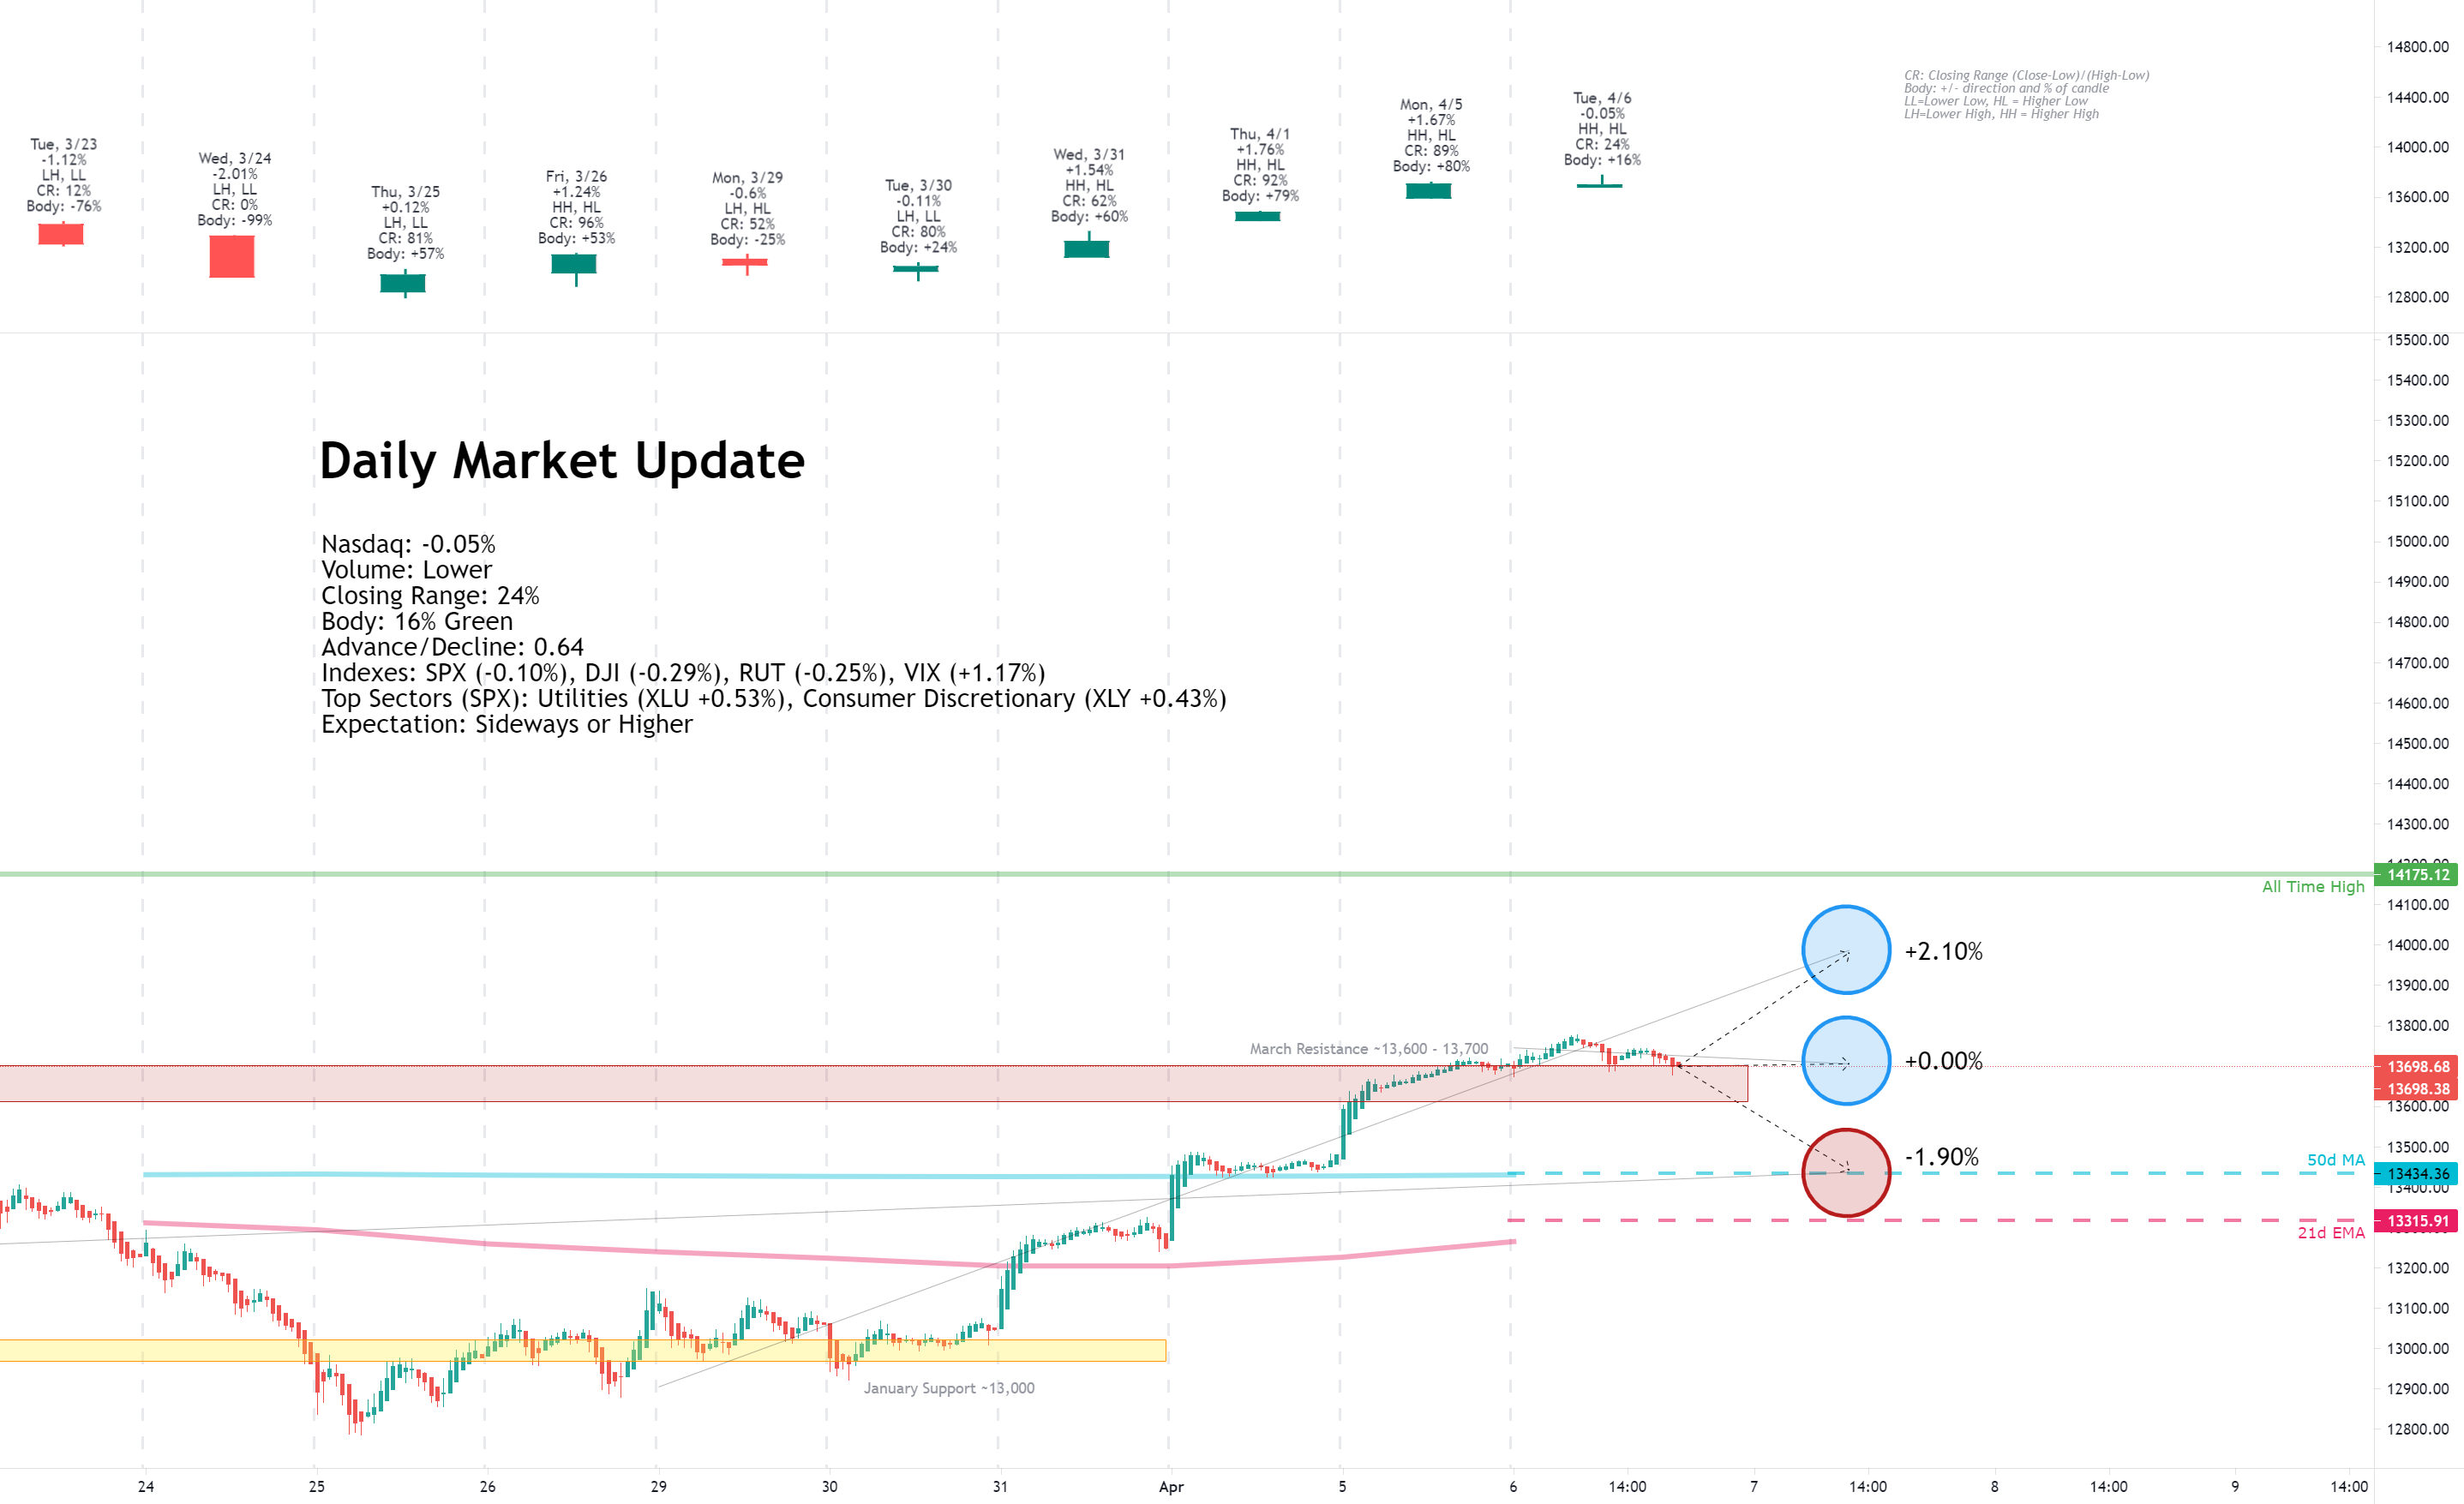
Tuesday, April 6, 2021
Facts: -0.05%, Volume lower, Closing range: 24%, Body: +16%
Good: Higher high, higher low, held support around 13,700
Bad: Long upper shadow from afternoon selling
Highs/Lows: Higher high, higher low
Candle: Long upper shadow above a thin green body
Advance/Decline: About three declining for every two advancing stocks.
Indexes: SPX (-0.10%), DJI (-0.29%), RUT (-0.25%), VIX (+1.17%)
Sectors: Utilities (XLU +0.53%) and Consumer Discretionary (XLY +0.43%) were top. Health Services (XLV -0.38%) and Technology (XLK -0.43%)
Expectation: Sideways or Higher
There was caution in the market on Tuesday after several days of record setting gains. Investors are monitoring the progress of infrastructure plans and the potential for new taxes. At the same time, the pandemic keeps popping up new fears as Canada declares a very serious third wave.
The Nasdaq closed with a small -0.05% loss, after climbing 0.5% in the morning. The closing range of 24% is above a thin 16% body signaling indecision. The long upper wick was formed from a morning rally that sold off in the afternoon. Still, the index seemed to have support around the 13,700 area, testing the area twice and settling just below the line at the close. There were 3 declining stocks for every 2 advancing stocks.
-=x=-=x=-=x=-=x=-=x=-=x=-=x=-
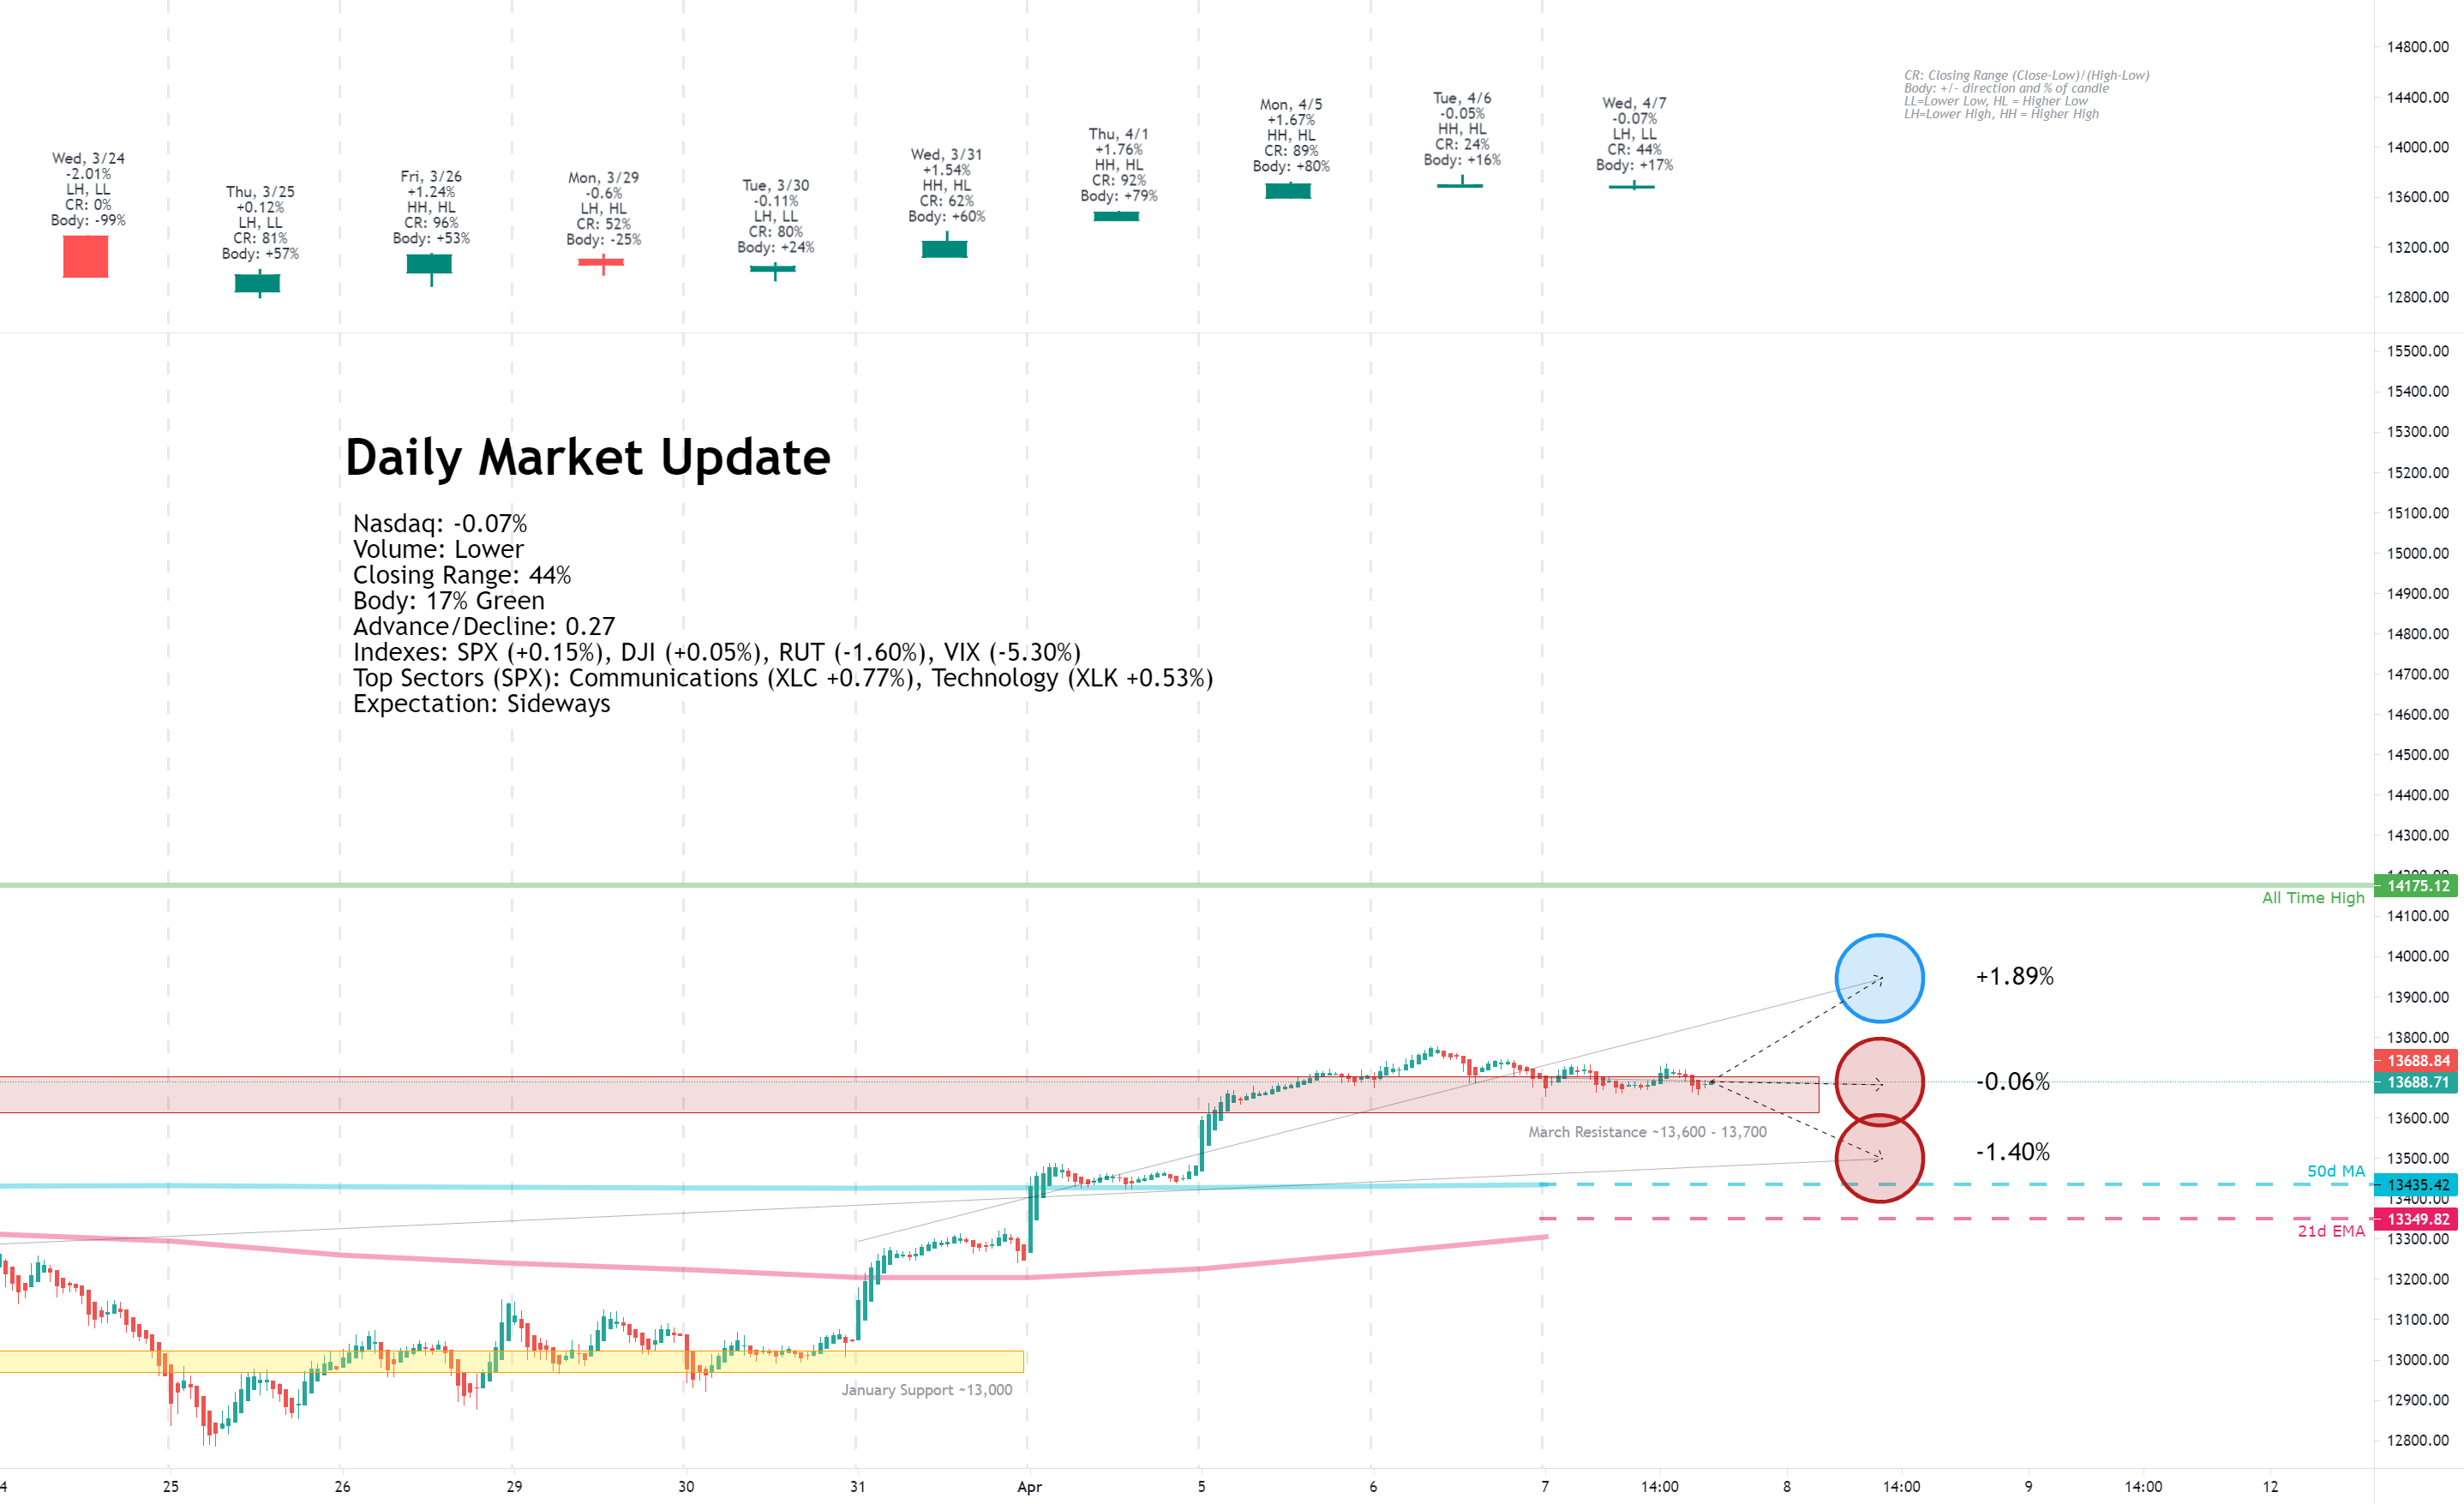
Wednesday, April 7, 2021
Facts: -0.07%, Volume lower, Closing range: 44%, Body: +17%
Good: Stayed near 13,700 support, lower volume, not a distribution day
Bad: Indecisive candle, no signal on direction
Highs/Lows: Lower high, lower low
Candle: Long upper shadow above a thin green body
Advance/Decline: About three declining for every two advancing stocks.
Indexes: SPX (+0.15%), DJI (+0.05%), RUT (-1.60%), VIX (-5.30%)
Sectors: Communications (XLC +0.77%) and Technology (XLK +0.53%) were top. Industrials (XLI -0.46%) and Materials (XLB -1.72%) were bottom.
Expectation: Sideways
It was a choppy side-ways session today for most of the market. The small caps suffered compared to the larger caps while mid-cap growth stocks had mixed results. Overall, investor sentiment remained cautious without many big reactions to economic news.
The Nasdaq closed with a -0.07% decline, another indecisive day without a clear signal on direction. The 17% body is in the lower half of the candle as the index attempted to find a rally twice but reversed quickly back to the 13,700 area. The closing range of 44% is better than the previous day, but the lower higher and lower low show the bears put up a good fight. There were nearly four declining stocks for every advancing stock.
-=x=-=x=-=x=-=x=-=x=-=x=-=x=-
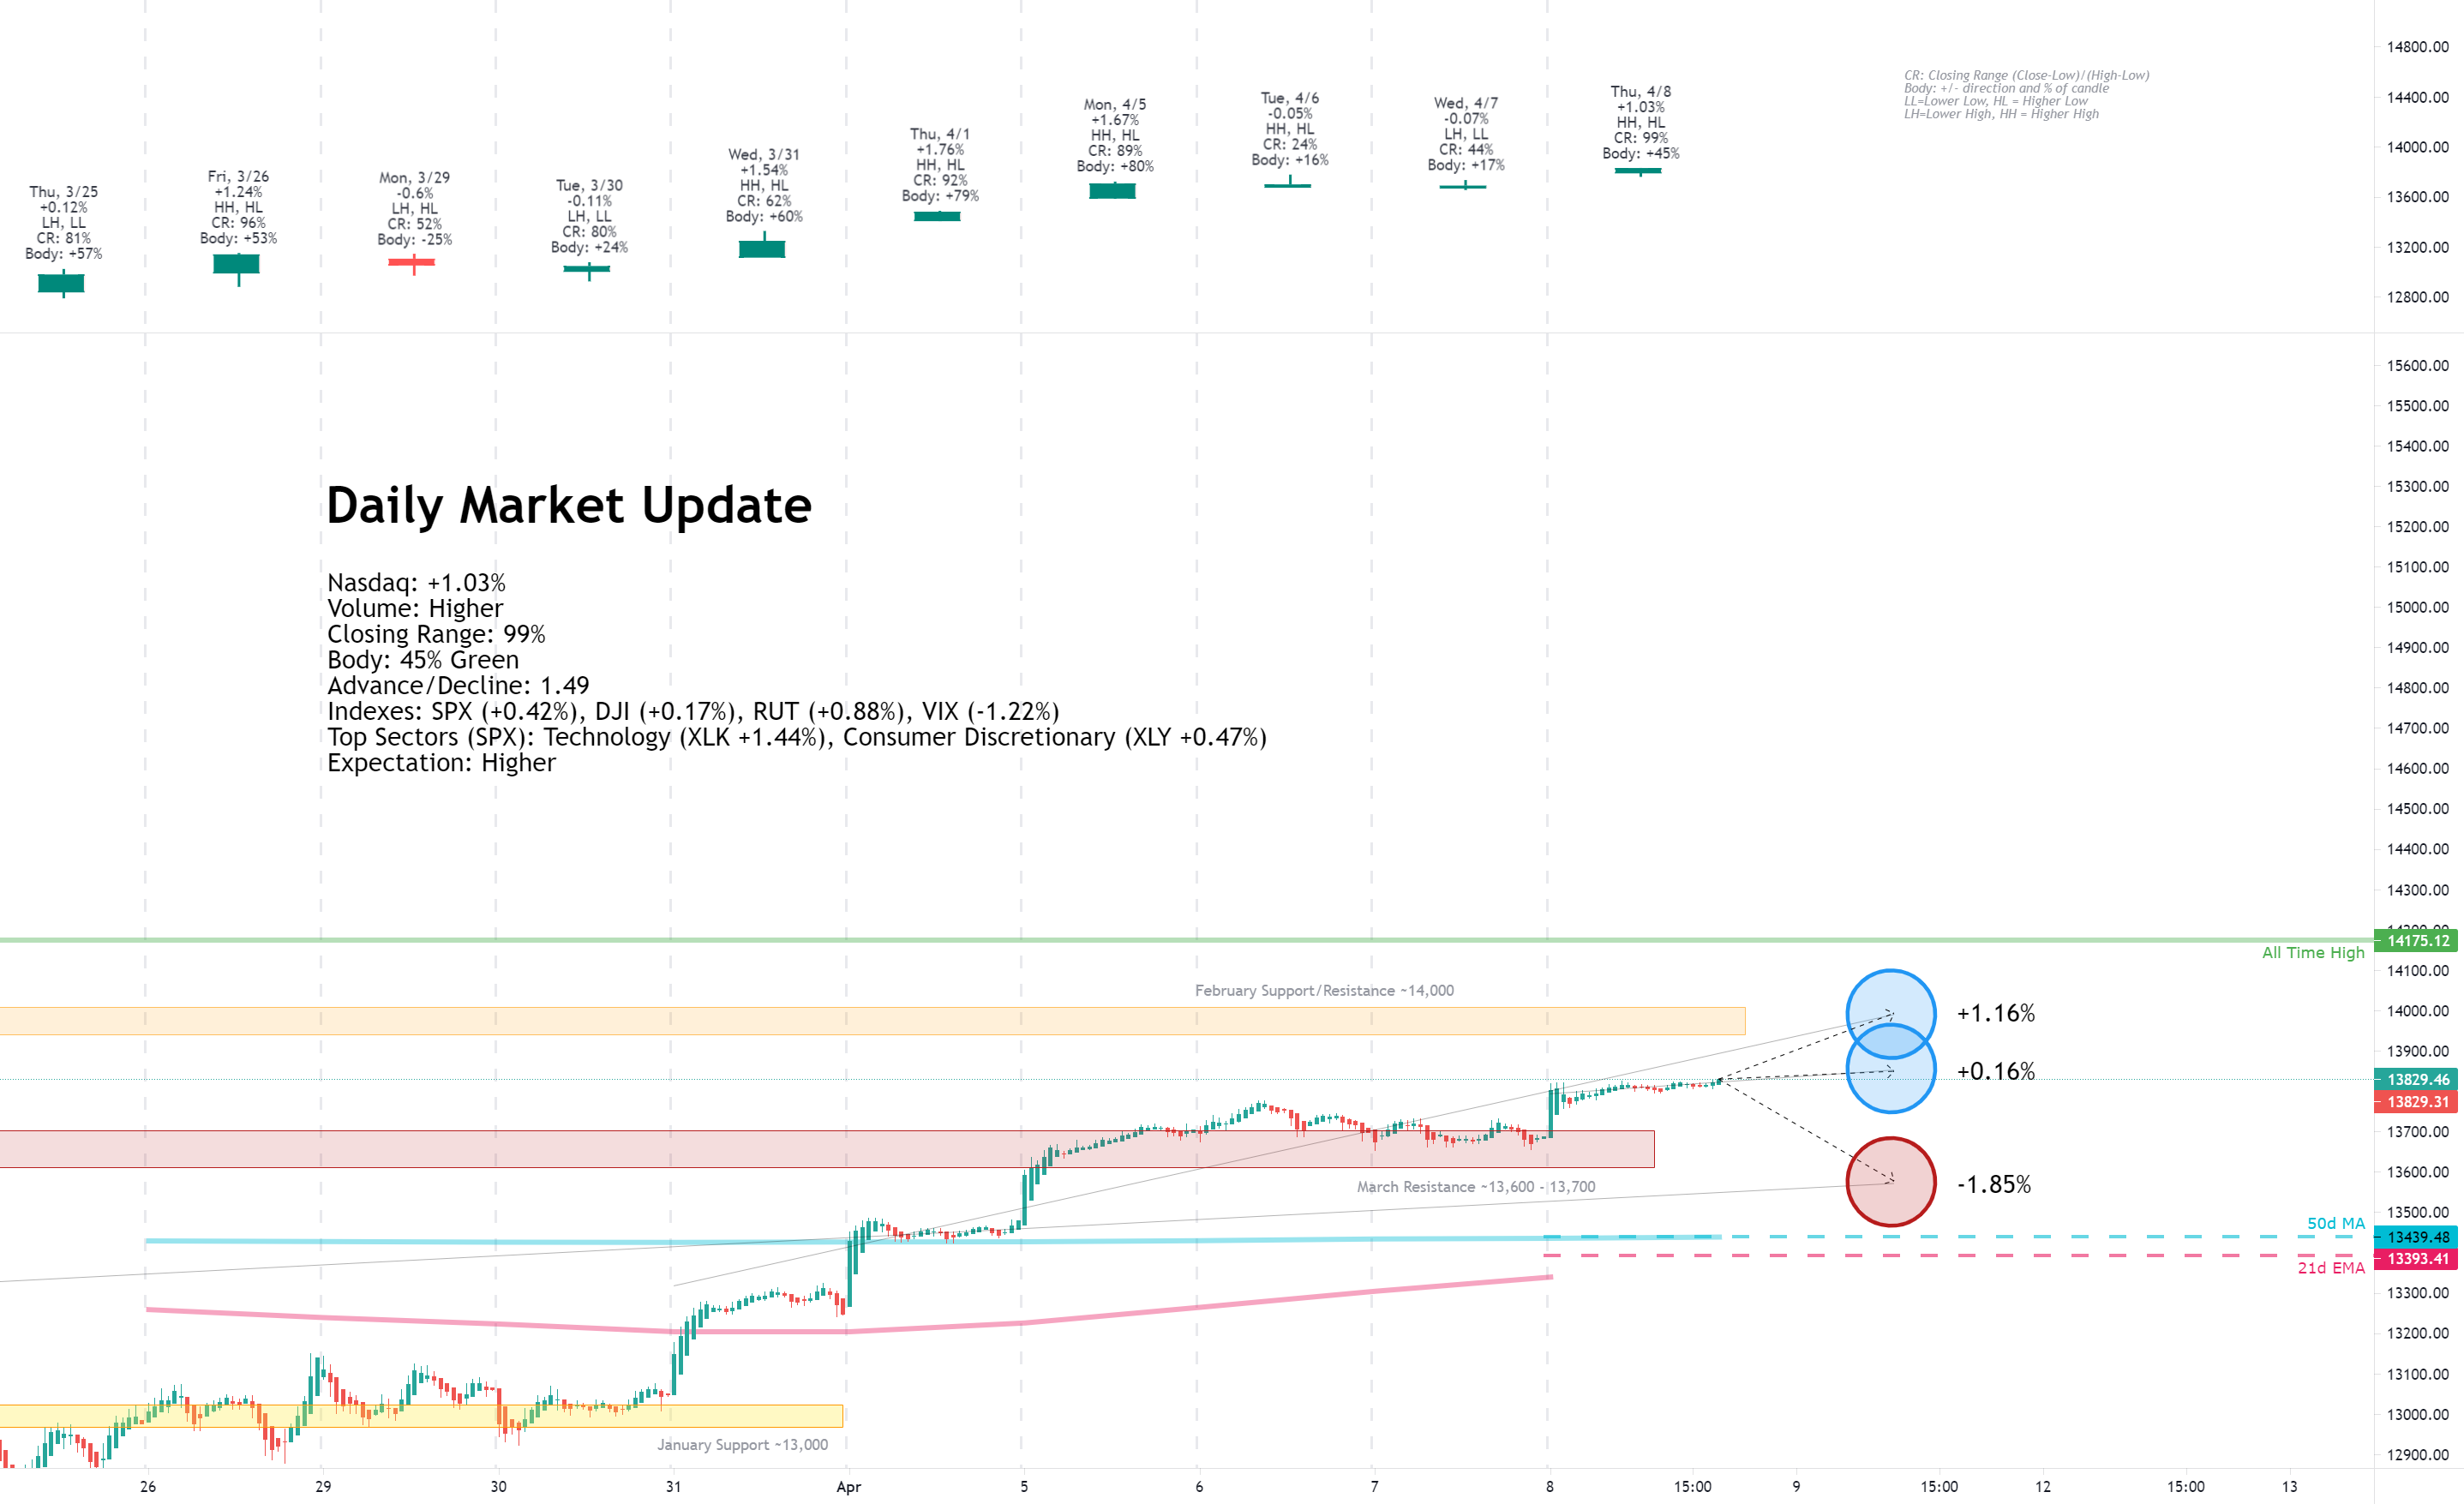
Thursday, April 8, 2021
Facts: +1.03%, Volume higher, Closing range: 99%, Body: +45%
Good: Gains all-day with few pullbacks, high closing range, higher volume
Bad: Nothing
Highs/Lows: Higher high, higher low
Candle: Longer lower wick under a green body, no upper wick
Advance/Decline: Three advancing for every two declining stocks
Indexes: SPX (+0.42%), DJI (+0.17%), RUT (+0.88%), VIX (-1.22%)
Sectors: Technology (XLK +1.44%) and Consumer Discretionary (XLY +0.47%) were top. Real Estate (XLRE -0.49%) and Energy (XLE -1.30%) were bottom.
Expectation: Higher
Investors shook off early nervousness over higher jobless claims and bulls led the markets rally throughout the day. Treasury yields, the US Dollar and commodity prices all supported Technology as the leading sector of the day, carrying the Nasdaq to the leading index of the day.
The Nasdaq closed with a +1.03% gain on higher volume. The 99% closing range resulted from a 45% green body at the top of the candle which opened with a gap above yesterday's close. The lower wick was formed in the morning, but the index quickly erased the dip with gains into the afternoon that ended with a rally at close. There were three advancing stocks for every declining stock.
-=x=-=x=-=x=-=x=-=x=-=x=-=x=-
Friday, April 9, 2021
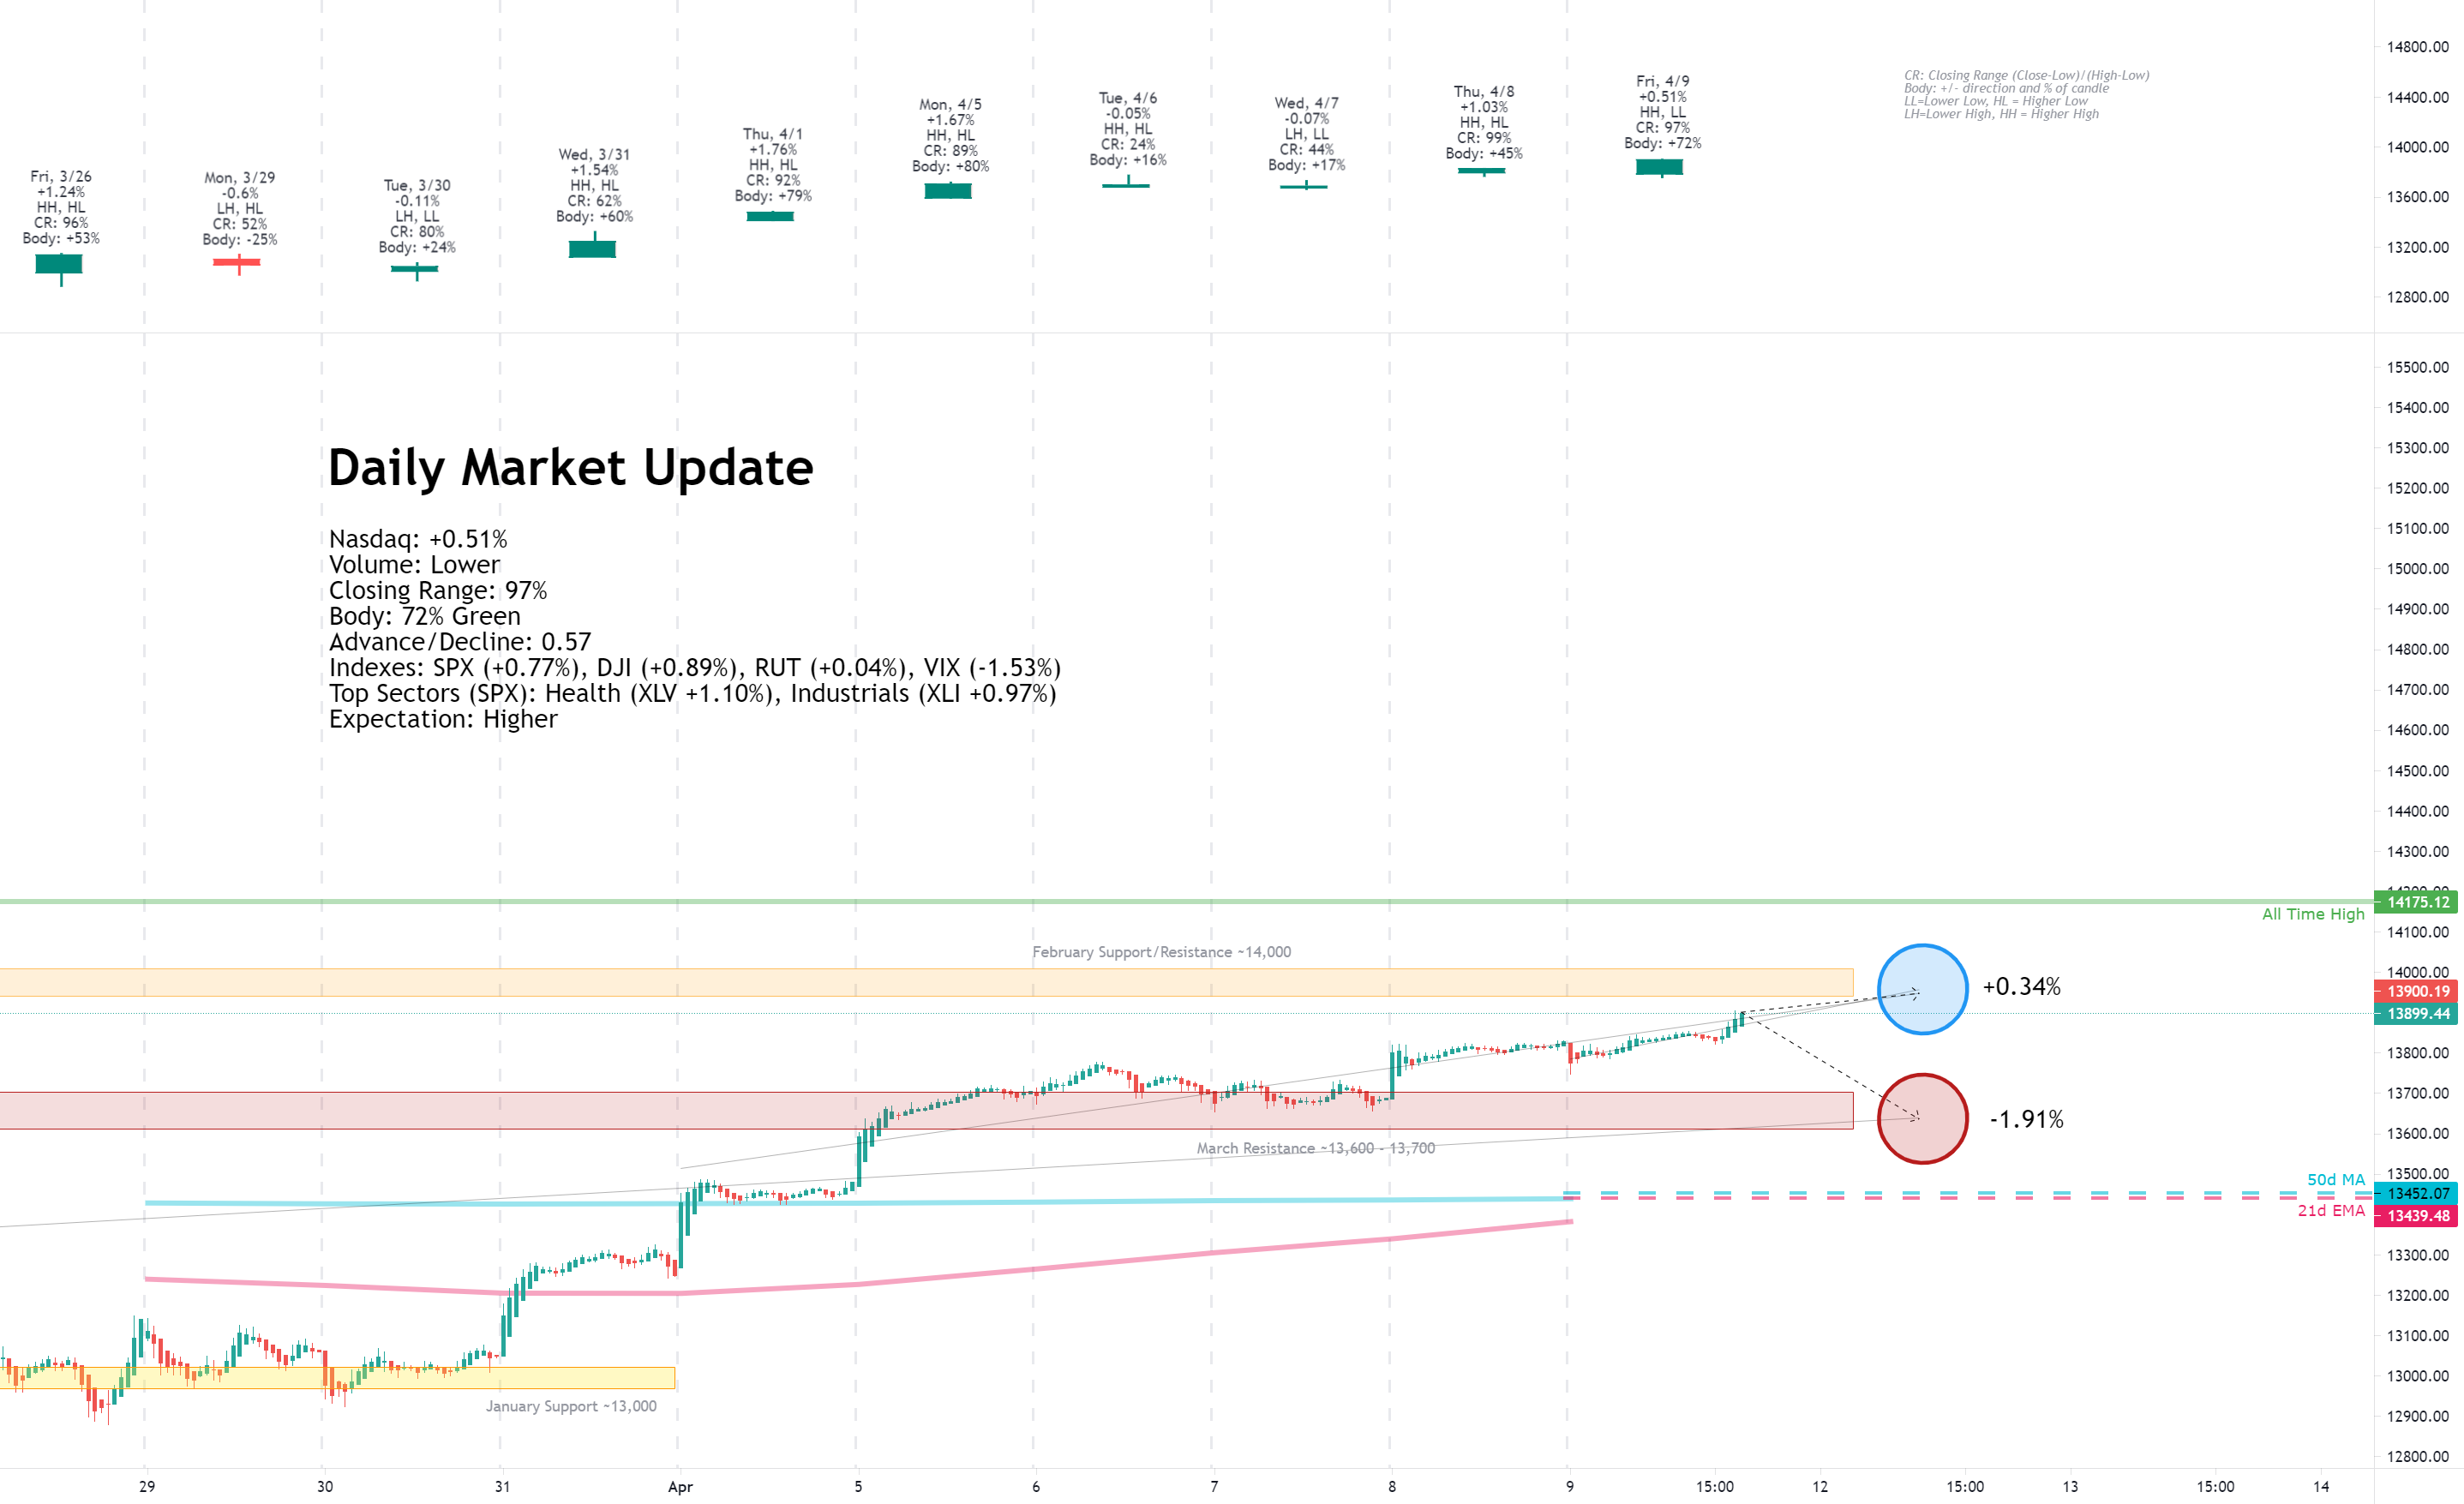
Facts: +0.51%, Volume lower, Closing range: 97%, Body: +72%
Good: Never revisited morning low, bullish buying rest of the day
Bad: Nothing
Highs/Lows: Higher high, lower low
Candle: Bullish outside day candle with short lower wick, almost no upper wick
Advance/Decline: Two declining stocks for every advancing stocks
Indexes: SPX (+0.42%), DJI (+0.17%), RUT (+0.88%), VIX (-1.22%)
Sectors: Health (XLV +1.10%) and Industrials (XLI +0.97%) were top. Consumer Staples (XLP -0.17%) and Energy (XLE -0.66%) were bottom.
Expectation: Higher
The morning producer price index numbers are a great sign for the economy as demand increases in manufactured goods indicates consumer demand. It's not a great sign if you are worried about inflation. The markets opened with a dip on the news, but quickly recovered as the dollar pulled back from the morning reaction to the news.
The Nasdaq closed the day with a rally to gain +0.51% with a closing range of 97%. Volume was lower but buyers were present throughout the day, leading to a 72% green body over a small lower wick from the morning dip. The higher high and lower low, with a high closing range, create a bullish outside candle.
-=x=-=x=-=x=-=x=-=x=-=x=-=x=-
The Meaning of Life (View on the Week)
The story of the week was the strength of big tech as the four largest mega-caps broke out of bases and drove indexes and their respective sectors higher. The week also saw a breakout of growth stocks relative to value stocks after a few months of rotation. It's still yet to be determined if the trends will stick, but the charts show a positive trend.
Although it was Apple with the big weekly gain, Alphabet, Microsoft and Tesla all helped kick-off the momentum on Monday. Microsoft continued gains from the previous week's big announcement deal with the US Army. Tesla announced record production and deliveries for the first quarter over the holiday weekend.
The gap-up on Monday took the index well past a declining resistance line. The big gain warranted a pause as the index tested the 13,700 resistance area. The next two days were mostly sideways choppy action. Investors showed caution in the market, signaled by the rise of Utilities from the bottom to the top of the sector chart during Tuesday's session. The caution continued into Wednesday even as mega-caps continued to advance.
Then a surprise consumer credit number arrived late on Wednesday. Instead of a $5B expected number for February, consumer credit rose to $27.58 signaling that consumers were not only confident (from the previous weeks data), but were spending money.
That was enough to continue the rally and the Nasdaq opened with another gap up on Thursday despite disappointing jobless claims in the morning. On top of the economic data, the USD dollar continued to weaken while the treasury yield curve was flattening and commodity prices showed high demand. It was bullish for the economy and the right context to see big tech and growth stocks soar.
Friday ended the week with an outside day. Prices dipped in the morning as inflation worries crept back into investors' minds after the produce price index data was higher than expected. Those worries subsided and the index continued its rally into the close for the week.
The Nasdaq advanced +3.12% for the week. The closing range is 99% for a second week in a row. Volume was lower.
The lowering volume trend is largely due to the absence of the retail investor. That is confirmed by VandaTrack, which tracks retail investors and shows they are taking a step back from the market. That's bad news if you want to play your hand in the next YOLO meme stock trade. But it's good news if you want to see fewer swings in the value of your portfolio.
The higher high and higher low is a great signal of the uptrend. The index closed just above 13,900 and is working toward the round number resistance of 14,000 before it moves toward a new all-time high.
The S&P 500 (SPX) and Dow Jones Industrial (DJI) both set new all-time highs, making +2.71% and +1.95% advances for the week. The Russell 2000 (RUT) retreated -0.46% for the week.
The Russell 2000 was outperforming since August but has been consolidating since hitting an all-time high in March. Certainly, small-caps and the index will benefit from market rallies, but the question will be at what level of relative performance to the rest of the market. This is something to watch over the coming weeks.
The VIX volatility index closed well with the pre-pandemic price range with another -3.69% decline. The absence of retail investors seems to have helped reduce some of the volatility in the market as well.
Growth broke out this week relative to value stocks. The dip in relative performance hit a low on March 8 and chopped back and forth before making a big move this week.
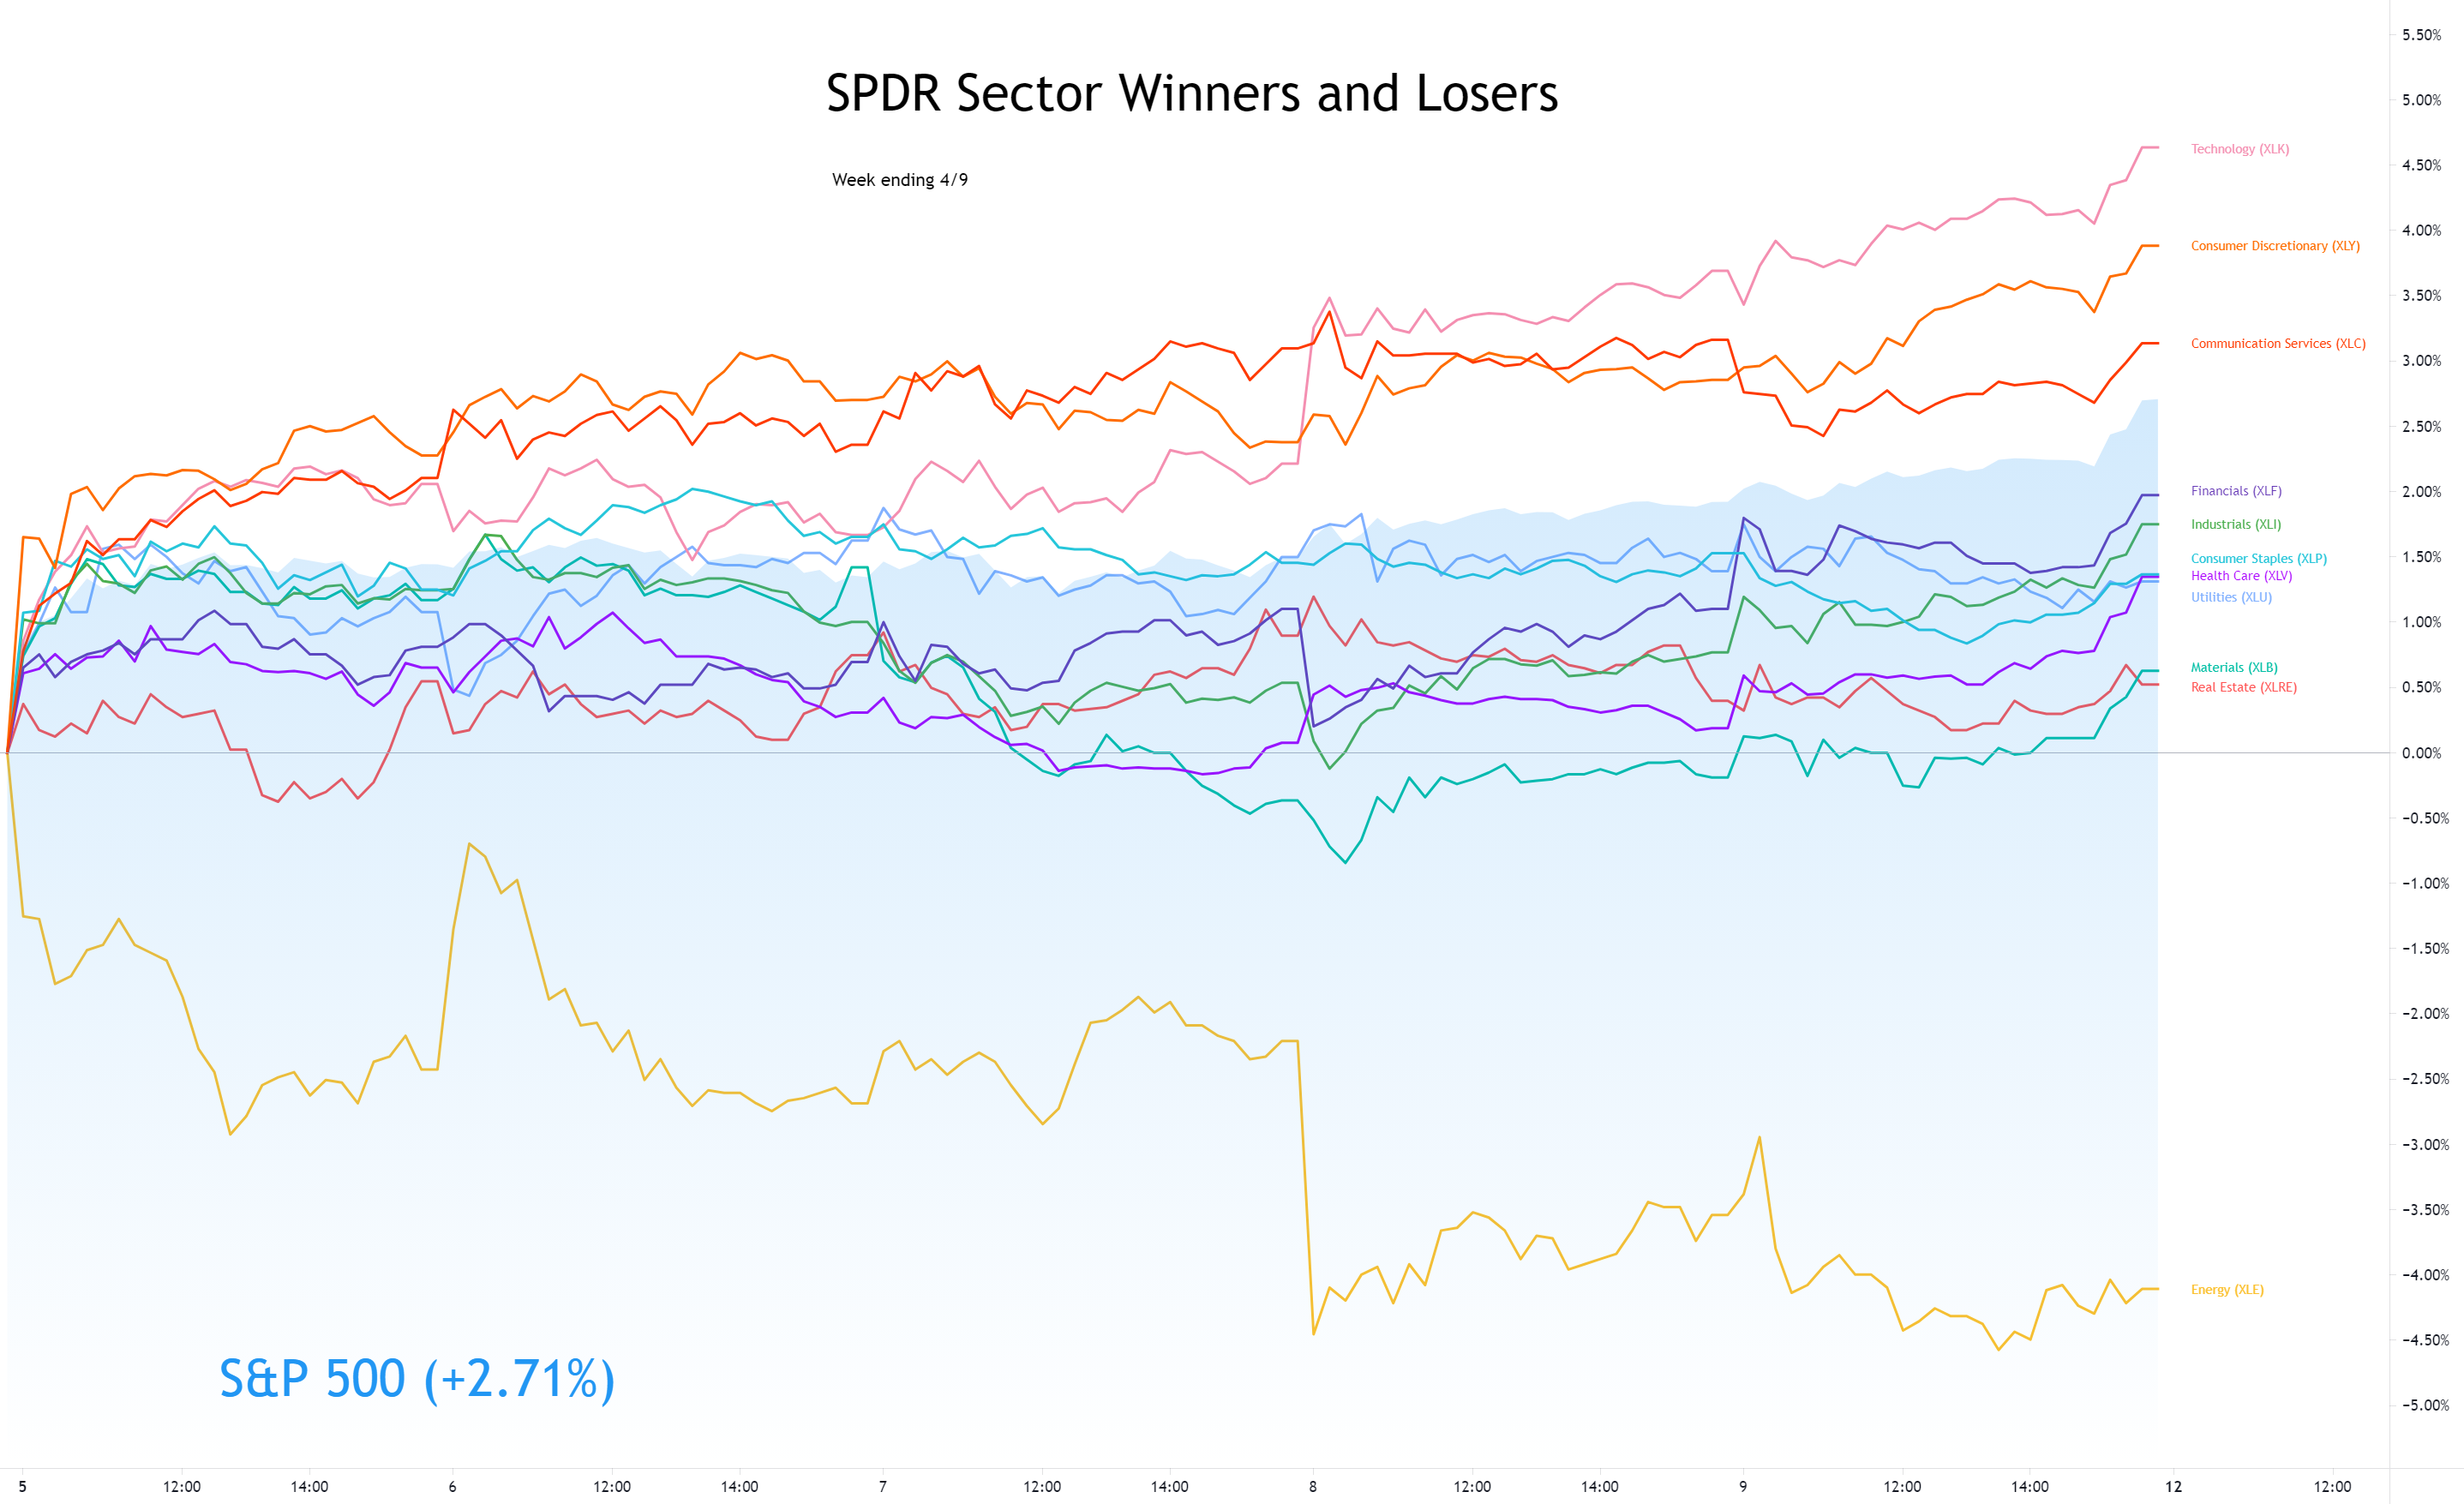
The S&P 500 was dominated by three growth sectors for the week.
Technology ( XLK ) finished the week as the top sector, taking the top spot on Thursday and Friday as big tech companies solidified breakouts from their recent consolidations.
Likewise, Consumer Discretionary ( XLY ) and Communication Services ( XLC ) finished in second and third place largely thanks for mega-caps that are overweight in the lists.
Energy ( XLE ) was at the bottom of the list with over a 4% decline. Some of that may be attributed to mixed outlook from analysts on supply and demand for oil . But Energy also tends to suffer when a large amount of investment rotates into the three big growth sectors.
Only Energy declined for the week. The other sectors had gains, albeit underperformed the broader S&P 500 index .
The 30y treasury bond yield gained slightly while the 10y note yield declined. The US 2y note yield also declined. Most importantly, the yield curve continues its trend of flattening, helping improve investor confidence in growth companies impacted by interest rates.
Both the High Yield Corporate Bond (HYG) and Investment Grade Bond (LQD) prices advanced for the week. The spread between corporate bonds and treasury bonds still has some tightening to get back to pre-pandemic levels, but the trend is heading in the right direction.
The US Dollar (DXY) retreated -0.89% this week giving a boost to big multi-national companies that can benefit from a weakened US Dollar.
The recovery of economic activity is accelerating and that can be seen clearly in demand for commodities.
Silver (SILVER) and Gold (GOLD) both advanced for the week.
Crude Oil Futures (CRUDEOIL1!) declined for the week as investors balance the increased output with expected recovery in demand.
Timber (WOOD) advanced for another week.
Copper (COPPER1!) and Aluminum (ALI1!) both advanced for the week.
-=x=-=x=-=x=-=x=-=x=-=x=-=x=-
The Big Four Mega-caps
It was a great week for the big four mega-caps. They all drove the indexes and their respective sectors higher.
Apple (AAPL) gained + 8.13%, Microsoft (MSFT) gained +5.57%, Amazon (AMZN) gained +6.68%, and Alphabet (GOOGL) gained +6.62%. All four now show the 10 week moving average line above the 40 week moving average line, confirming their uptrends.
As an added signal behind the strength of these breakout moves in the mega-caps, note at the volume is higher for all of them and at the bottom, the thick blue bars show a strong outperformance of the Nasdaq.
-=x=-=x=-=x=-=x=-=x=-=x=-=x=-
The Four Recovery Stocks
I picked four recovery stocks to track against the indexes and other indicators in this weekly report. Carnival Cruise Lines (CCL) gained over 9% after providing a cautiously optimistic outlook for this year during their earnings announcement. Delta Airlines (DAL) and Marriott (MAR) both held onto gains for the week, despite their red candles. Exxon Mobil (XOM) declined for the week, pulled down by downgrade of Chevron and sell-off of Energy stocks.
-=x=-=x=-=x=-=x=-=x=-=x=-=x=-
Investor Sentiment
The put/call ratio (PCCE) closed the week 0.588. A contrarian indicator, when the put/call ratio is below 0.7, it signals overly bullish sentiment and could mean an overbought market.
The CNN Fear & Greed index remained in the same area, on the side of greed, for most of the week.
The NAAIM exposure index rose to 89.85, showing money managers are increasing position sizes again.
-=x=-=x=-=x=-=x=-=x=-=x=-=x=-
The Week Ahead
There will be Treasury auctions for 10y and 3y notes on Monday afternoon. The performance of those auctions could impact investor sentiment in the bond market and send yields in either direction.
Consumer Price Index data for March will be released on Tuesday. The data compliments the produce price index data released this past week. The produce price index data is leading indicator to consumer price index data, both providing an outlook on inflation.
Economic news for Wednesday includes Export/Import Price index data before markets open. Crude Oil Inventory data will be released after the market opens.
Thursday has several economic data releases. Initial Jobless Claims data before the market opens will hopefully recover a bit from last week's negative surprise. Retail Sales data for March should show an improvement over the February numbers that were brought down by weather events. The Manufacturing Index data and Industrial Production data will also be leading indicators on the recovery of economic activity.
Building Permits and Housing Starts data will be released on Friday morning. We will also get an update on Consumer Expectations and Consumer Sentiment.
This quarters earning season will pick up next week, dominated by earnings reports in the Financial sector.
Monday and Tuesday do not have any notable reports for the daily update.
On Wednesday, JP Morgan (JPM), Wells Fargo (WFC), Goldman Sachs (GS) will release earnings reports. In addition, retail stocks Bed, Bath and Beyond (BBBY) and Lovesac (LOVE) will release earnings.
On Thursday, the Financial sector earnings reports will include Bank of America (BAC), Citigroup (C), Charles Schwab (SCHW) and BlackRock (BLK). Taiwan Semiconductor (TSM), UnitedHealth (UNH), Delta Airlines (DAL) will also be closely watch earnings reports for the day.
Friday's reports include Honeywell (HON) and Morgan Stanley (MS).
-=x=-=x=-=x=-=x=-=x=-=x=-=x=-
The Bullish Side
A lot of the bullish side is a continuation of the signals we saw at the end of the previous week. The mega-caps continued breakout moves on higher volume this week which has led the indexes higher and restored confidence in big tech and growth stocks.
The volatility in the market continues to drop to pre-pandemic levels as retail investors spent new stimulus checks on something other than meme stocks. The US Dollar and Treasury Yields have also stopped their climbs that was causing investors to worry about interest rates impacting growth companies while the US Dollar impacts the bottom line of multi-nationals.
The growth sectors of Technology, Communications and Consumer Discretionary are leading the market higher. These sectors focused on innovation, have been responsible for many of the big rallies over the past decade.
The pop in consumer credit came as a positive surprise this past week. Consumer sentiment numbers this week could add to the positive outlook on spending as consumers unleash record-setting savings and new stimulus checks into the economy.
-=x=-=x=-=x=-=x=-=x=-=x=-=x=-
The Bearish Side
Investors are not worry-free. Biden's infrastructure plans and proposal for higher corporate taxes are having analysts and investors calculating the impact to sectors and valuations of US companies. The progress of these proposals in congress will keep investors on their toes for the coming weeks.
Inflation also continues to be a top worry, stoked by Friday's produce price index data. The inflation outlook could get worse as consumer price index data is released this week. The Fed's assurance to not change monetary policy to control inflation only helps calm the worries to a certain degree.
Energy being at the bottom of the sector list is another sign of the uncertainty. Analysts are watching closely as the pandemic hits third-waves in many countries which could cause lower than hoped demand for travel and leisure, and likewise lower demand for oil. While OPEC is cautiously increasing supply, a sharp pull back in demand will cause the sector further losses.
-=x=-=x=-=x=-=x=-=x=-=x=-=x=-
Key Nasdaq Levels to Watch
The Nasdaq cleared key areas of resistance this past week, leaving just a few key levels in between Friday's close and a new all-time high.
On the positive side, the levels are:
I do occasionally have some errors or typos and will correct them in my blog or in the comments on TradingView. I do not have an editor and do this in my free time.
If you find this helpful, please let me know in the comments. I am also more than happy to add new perspectives and data points if you have ideas.
The structure is the following:
- A recap of the daily updates that I do here on TradingView.
- The Meaning of Life, a view on the past week
- What's coming in the next week
- The Bullish View, The Bearish View
- Key index levels to watch out for
- Wrap-up
If you have been following my daily updates, you can skip down to the “The Meaning of Life”. If not, then this first part is a great play-by-play recap for the week. Click the daily charts for more detail on sectors, indexes and market leaders each day.
-=x=-=x=-=x=-=x=-=x=-=x=-=x=-
Monday, April 5, 2021
Facts: +1.67%, Volume lower, Closing range: 94% (w/Gap), Body: +80%
Good: Three positive days in a row, above 13,700 confirmed with a quick retest
Bad: Lowering volume
Highs/Lows: Higher high, higher low
Candle: Gap up, mostly green body with a slightly longer upper wick
Advance/Decline: About the same number of advancing as declining stocks.
Indexes: SPX (+1.44%), DJI (+1.13%), RUT (+0.49%), VIX (+3.35%)
Sectors: Consumer Discretionary (XLY +2.27%) and Communications (XLC +2.11%) were top. Energy (XLE -2.39%) was the only declining sector.
Expectation: Higher
The markets set new records on Monday led by gains from the largest public companies in Consumer Discretionary, Communications and Technology. The S&P 500 and Dow Jones Industrial marked new all-time highs with a bullish session that began the day with opening gap ups.
The Nasdaq closed the day with a +1.67% gain on lower volume. The closing range of 94% includes the morning gap-up that led to an 80% green body. A minor fade in the afternoon created a slightly longer upper wick than the lower wick but the higher high and higher low continue a strong uptrend from last week's pivot. There were about the same number of gaining stocks as declining stocks.
-=x=-=x=-=x=-=x=-=x=-=x=-=x=-
Tuesday, April 6, 2021
Facts: -0.05%, Volume lower, Closing range: 24%, Body: +16%
Good: Higher high, higher low, held support around 13,700
Bad: Long upper shadow from afternoon selling
Highs/Lows: Higher high, higher low
Candle: Long upper shadow above a thin green body
Advance/Decline: About three declining for every two advancing stocks.
Indexes: SPX (-0.10%), DJI (-0.29%), RUT (-0.25%), VIX (+1.17%)
Sectors: Utilities (XLU +0.53%) and Consumer Discretionary (XLY +0.43%) were top. Health Services (XLV -0.38%) and Technology (XLK -0.43%)
Expectation: Sideways or Higher
There was caution in the market on Tuesday after several days of record setting gains. Investors are monitoring the progress of infrastructure plans and the potential for new taxes. At the same time, the pandemic keeps popping up new fears as Canada declares a very serious third wave.
The Nasdaq closed with a small -0.05% loss, after climbing 0.5% in the morning. The closing range of 24% is above a thin 16% body signaling indecision. The long upper wick was formed from a morning rally that sold off in the afternoon. Still, the index seemed to have support around the 13,700 area, testing the area twice and settling just below the line at the close. There were 3 declining stocks for every 2 advancing stocks.
-=x=-=x=-=x=-=x=-=x=-=x=-=x=-
Wednesday, April 7, 2021
Facts: -0.07%, Volume lower, Closing range: 44%, Body: +17%
Good: Stayed near 13,700 support, lower volume, not a distribution day
Bad: Indecisive candle, no signal on direction
Highs/Lows: Lower high, lower low
Candle: Long upper shadow above a thin green body
Advance/Decline: About three declining for every two advancing stocks.
Indexes: SPX (+0.15%), DJI (+0.05%), RUT (-1.60%), VIX (-5.30%)
Sectors: Communications (XLC +0.77%) and Technology (XLK +0.53%) were top. Industrials (XLI -0.46%) and Materials (XLB -1.72%) were bottom.
Expectation: Sideways
It was a choppy side-ways session today for most of the market. The small caps suffered compared to the larger caps while mid-cap growth stocks had mixed results. Overall, investor sentiment remained cautious without many big reactions to economic news.
The Nasdaq closed with a -0.07% decline, another indecisive day without a clear signal on direction. The 17% body is in the lower half of the candle as the index attempted to find a rally twice but reversed quickly back to the 13,700 area. The closing range of 44% is better than the previous day, but the lower higher and lower low show the bears put up a good fight. There were nearly four declining stocks for every advancing stock.
-=x=-=x=-=x=-=x=-=x=-=x=-=x=-
Thursday, April 8, 2021
Facts: +1.03%, Volume higher, Closing range: 99%, Body: +45%
Good: Gains all-day with few pullbacks, high closing range, higher volume
Bad: Nothing
Highs/Lows: Higher high, higher low
Candle: Longer lower wick under a green body, no upper wick
Advance/Decline: Three advancing for every two declining stocks
Indexes: SPX (+0.42%), DJI (+0.17%), RUT (+0.88%), VIX (-1.22%)
Sectors: Technology (XLK +1.44%) and Consumer Discretionary (XLY +0.47%) were top. Real Estate (XLRE -0.49%) and Energy (XLE -1.30%) were bottom.
Expectation: Higher
Investors shook off early nervousness over higher jobless claims and bulls led the markets rally throughout the day. Treasury yields, the US Dollar and commodity prices all supported Technology as the leading sector of the day, carrying the Nasdaq to the leading index of the day.
The Nasdaq closed with a +1.03% gain on higher volume. The 99% closing range resulted from a 45% green body at the top of the candle which opened with a gap above yesterday's close. The lower wick was formed in the morning, but the index quickly erased the dip with gains into the afternoon that ended with a rally at close. There were three advancing stocks for every declining stock.
-=x=-=x=-=x=-=x=-=x=-=x=-=x=-
Friday, April 9, 2021
Facts: +0.51%, Volume lower, Closing range: 97%, Body: +72%
Good: Never revisited morning low, bullish buying rest of the day
Bad: Nothing
Highs/Lows: Higher high, lower low
Candle: Bullish outside day candle with short lower wick, almost no upper wick
Advance/Decline: Two declining stocks for every advancing stocks
Indexes: SPX (+0.42%), DJI (+0.17%), RUT (+0.88%), VIX (-1.22%)
Sectors: Health (XLV +1.10%) and Industrials (XLI +0.97%) were top. Consumer Staples (XLP -0.17%) and Energy (XLE -0.66%) were bottom.
Expectation: Higher
The morning producer price index numbers are a great sign for the economy as demand increases in manufactured goods indicates consumer demand. It's not a great sign if you are worried about inflation. The markets opened with a dip on the news, but quickly recovered as the dollar pulled back from the morning reaction to the news.
The Nasdaq closed the day with a rally to gain +0.51% with a closing range of 97%. Volume was lower but buyers were present throughout the day, leading to a 72% green body over a small lower wick from the morning dip. The higher high and lower low, with a high closing range, create a bullish outside candle.
-=x=-=x=-=x=-=x=-=x=-=x=-=x=-
The Meaning of Life (View on the Week)
The story of the week was the strength of big tech as the four largest mega-caps broke out of bases and drove indexes and their respective sectors higher. The week also saw a breakout of growth stocks relative to value stocks after a few months of rotation. It's still yet to be determined if the trends will stick, but the charts show a positive trend.
Although it was Apple with the big weekly gain, Alphabet, Microsoft and Tesla all helped kick-off the momentum on Monday. Microsoft continued gains from the previous week's big announcement deal with the US Army. Tesla announced record production and deliveries for the first quarter over the holiday weekend.
The gap-up on Monday took the index well past a declining resistance line. The big gain warranted a pause as the index tested the 13,700 resistance area. The next two days were mostly sideways choppy action. Investors showed caution in the market, signaled by the rise of Utilities from the bottom to the top of the sector chart during Tuesday's session. The caution continued into Wednesday even as mega-caps continued to advance.
Then a surprise consumer credit number arrived late on Wednesday. Instead of a $5B expected number for February, consumer credit rose to $27.58 signaling that consumers were not only confident (from the previous weeks data), but were spending money.
That was enough to continue the rally and the Nasdaq opened with another gap up on Thursday despite disappointing jobless claims in the morning. On top of the economic data, the USD dollar continued to weaken while the treasury yield curve was flattening and commodity prices showed high demand. It was bullish for the economy and the right context to see big tech and growth stocks soar.
Friday ended the week with an outside day. Prices dipped in the morning as inflation worries crept back into investors' minds after the produce price index data was higher than expected. Those worries subsided and the index continued its rally into the close for the week.
The Nasdaq advanced +3.12% for the week. The closing range is 99% for a second week in a row. Volume was lower.
The lowering volume trend is largely due to the absence of the retail investor. That is confirmed by VandaTrack, which tracks retail investors and shows they are taking a step back from the market. That's bad news if you want to play your hand in the next YOLO meme stock trade. But it's good news if you want to see fewer swings in the value of your portfolio.
The higher high and higher low is a great signal of the uptrend. The index closed just above 13,900 and is working toward the round number resistance of 14,000 before it moves toward a new all-time high.
The S&P 500 (SPX) and Dow Jones Industrial (DJI) both set new all-time highs, making +2.71% and +1.95% advances for the week. The Russell 2000 (RUT) retreated -0.46% for the week.
The Russell 2000 was outperforming since August but has been consolidating since hitting an all-time high in March. Certainly, small-caps and the index will benefit from market rallies, but the question will be at what level of relative performance to the rest of the market. This is something to watch over the coming weeks.
The VIX volatility index closed well with the pre-pandemic price range with another -3.69% decline. The absence of retail investors seems to have helped reduce some of the volatility in the market as well.
Growth broke out this week relative to value stocks. The dip in relative performance hit a low on March 8 and chopped back and forth before making a big move this week.
The S&P 500 was dominated by three growth sectors for the week.
Technology ( XLK ) finished the week as the top sector, taking the top spot on Thursday and Friday as big tech companies solidified breakouts from their recent consolidations.
Likewise, Consumer Discretionary ( XLY ) and Communication Services ( XLC ) finished in second and third place largely thanks for mega-caps that are overweight in the lists.
Energy ( XLE ) was at the bottom of the list with over a 4% decline. Some of that may be attributed to mixed outlook from analysts on supply and demand for oil . But Energy also tends to suffer when a large amount of investment rotates into the three big growth sectors.
Only Energy declined for the week. The other sectors had gains, albeit underperformed the broader S&P 500 index .
The 30y treasury bond yield gained slightly while the 10y note yield declined. The US 2y note yield also declined. Most importantly, the yield curve continues its trend of flattening, helping improve investor confidence in growth companies impacted by interest rates.
Both the High Yield Corporate Bond (HYG) and Investment Grade Bond (LQD) prices advanced for the week. The spread between corporate bonds and treasury bonds still has some tightening to get back to pre-pandemic levels, but the trend is heading in the right direction.
The US Dollar (DXY) retreated -0.89% this week giving a boost to big multi-national companies that can benefit from a weakened US Dollar.
The recovery of economic activity is accelerating and that can be seen clearly in demand for commodities.
Silver (SILVER) and Gold (GOLD) both advanced for the week.
Crude Oil Futures (CRUDEOIL1!) declined for the week as investors balance the increased output with expected recovery in demand.
Timber (WOOD) advanced for another week.
Copper (COPPER1!) and Aluminum (ALI1!) both advanced for the week.
-=x=-=x=-=x=-=x=-=x=-=x=-=x=-
The Big Four Mega-caps
It was a great week for the big four mega-caps. They all drove the indexes and their respective sectors higher.
Apple (AAPL) gained + 8.13%, Microsoft (MSFT) gained +5.57%, Amazon (AMZN) gained +6.68%, and Alphabet (GOOGL) gained +6.62%. All four now show the 10 week moving average line above the 40 week moving average line, confirming their uptrends.
As an added signal behind the strength of these breakout moves in the mega-caps, note at the volume is higher for all of them and at the bottom, the thick blue bars show a strong outperformance of the Nasdaq.
-=x=-=x=-=x=-=x=-=x=-=x=-=x=-
The Four Recovery Stocks
I picked four recovery stocks to track against the indexes and other indicators in this weekly report. Carnival Cruise Lines (CCL) gained over 9% after providing a cautiously optimistic outlook for this year during their earnings announcement. Delta Airlines (DAL) and Marriott (MAR) both held onto gains for the week, despite their red candles. Exxon Mobil (XOM) declined for the week, pulled down by downgrade of Chevron and sell-off of Energy stocks.
-=x=-=x=-=x=-=x=-=x=-=x=-=x=-
Investor Sentiment
The put/call ratio (PCCE) closed the week 0.588. A contrarian indicator, when the put/call ratio is below 0.7, it signals overly bullish sentiment and could mean an overbought market.
The CNN Fear & Greed index remained in the same area, on the side of greed, for most of the week.
The NAAIM exposure index rose to 89.85, showing money managers are increasing position sizes again.
-=x=-=x=-=x=-=x=-=x=-=x=-=x=-
The Week Ahead
There will be Treasury auctions for 10y and 3y notes on Monday afternoon. The performance of those auctions could impact investor sentiment in the bond market and send yields in either direction.
Consumer Price Index data for March will be released on Tuesday. The data compliments the produce price index data released this past week. The produce price index data is leading indicator to consumer price index data, both providing an outlook on inflation.
Economic news for Wednesday includes Export/Import Price index data before markets open. Crude Oil Inventory data will be released after the market opens.
Thursday has several economic data releases. Initial Jobless Claims data before the market opens will hopefully recover a bit from last week's negative surprise. Retail Sales data for March should show an improvement over the February numbers that were brought down by weather events. The Manufacturing Index data and Industrial Production data will also be leading indicators on the recovery of economic activity.
Building Permits and Housing Starts data will be released on Friday morning. We will also get an update on Consumer Expectations and Consumer Sentiment.
This quarters earning season will pick up next week, dominated by earnings reports in the Financial sector.
Monday and Tuesday do not have any notable reports for the daily update.
On Wednesday, JP Morgan (JPM), Wells Fargo (WFC), Goldman Sachs (GS) will release earnings reports. In addition, retail stocks Bed, Bath and Beyond (BBBY) and Lovesac (LOVE) will release earnings.
On Thursday, the Financial sector earnings reports will include Bank of America (BAC), Citigroup (C), Charles Schwab (SCHW) and BlackRock (BLK). Taiwan Semiconductor (TSM), UnitedHealth (UNH), Delta Airlines (DAL) will also be closely watch earnings reports for the day.
Friday's reports include Honeywell (HON) and Morgan Stanley (MS).
-=x=-=x=-=x=-=x=-=x=-=x=-=x=-
The Bullish Side
A lot of the bullish side is a continuation of the signals we saw at the end of the previous week. The mega-caps continued breakout moves on higher volume this week which has led the indexes higher and restored confidence in big tech and growth stocks.
The volatility in the market continues to drop to pre-pandemic levels as retail investors spent new stimulus checks on something other than meme stocks. The US Dollar and Treasury Yields have also stopped their climbs that was causing investors to worry about interest rates impacting growth companies while the US Dollar impacts the bottom line of multi-nationals.
The growth sectors of Technology, Communications and Consumer Discretionary are leading the market higher. These sectors focused on innovation, have been responsible for many of the big rallies over the past decade.
The pop in consumer credit came as a positive surprise this past week. Consumer sentiment numbers this week could add to the positive outlook on spending as consumers unleash record-setting savings and new stimulus checks into the economy.
-=x=-=x=-=x=-=x=-=x=-=x=-=x=-
The Bearish Side
Investors are not worry-free. Biden's infrastructure plans and proposal for higher corporate taxes are having analysts and investors calculating the impact to sectors and valuations of US companies. The progress of these proposals in congress will keep investors on their toes for the coming weeks.
Inflation also continues to be a top worry, stoked by Friday's produce price index data. The inflation outlook could get worse as consumer price index data is released this week. The Fed's assurance to not change monetary policy to control inflation only helps calm the worries to a certain degree.
Energy being at the bottom of the sector list is another sign of the uncertainty. Analysts are watching closely as the pandemic hits third-waves in many countries which could cause lower than hoped demand for travel and leisure, and likewise lower demand for oil. While OPEC is cautiously increasing supply, a sharp pull back in demand will cause the sector further losses.
-=x=-=x=-=x=-=x=-=x=-=x=-=x=-
Key Nasdaq Levels to Watch
The Nasdaq cleared key areas of resistance this past week, leaving just a few key levels in between Friday's close and a new all-time high.
On the positive side, the levels are:
- 13,905.41 is the high of this week. Make a new high for next week to continue the uptrend.
- 14,000 will be the next area of resistance. Round numbers tend to be areas of resistance as they become triggers for alerts and buy/sell rules.
- The all-time high is at 14,175.12. That might be a stretch to get there this week, but keep it in our sites.
On the downside, there are a few key levels:
- The low of this past week is 13,582.76.
- The moving average lines are all very close together. The 10d MA is at 13,479.31.
- The 50d moving average is at 13,452.07.
- The 21d exponential moving average is at 13,439.48. Look for the index to stay above these averages and for the 21d EMA to cross above the 50d MA.
- The lower line of the channel from the March 2020 bottom is around 13,128 for next week.
- The low of this past week is 12,922.57. Stay above that price to give us a higher low for this week.
-=x=-=x=-=x=-=x=-=x=-=x=-=x=-
Wrap-up
The signals looked good coming into this week and continue to show positive signs for next week. There are certainly a few things we'd like to see to remain confident.
For the Nasdaq, clear the 14,000 line and set a new all-time high, joining the other major indexes. That will require big tech and growth stocks to continue to rally.
The Russell 2000 is not participating in the rally thus far. Having it break out of the symmetrical triangle and begin moving along with the other indexes will be a positive sign of broad support in the market.
There's a lot of be positive about, but don't forget things can always change quickly.
Good luck, stay healthy and trade safe!