Summary: Where does the market want to go next? That is the question to be answered after a week of mixed economic news met with COVID fears and uncertainty around what's happening with the infrastructure bill and government debt. Equity markets set new record highs as Treasury yields rose, setting up a possible pivot for next week.
Notes
The structure is the following:
If you have been following my daily updates, you can skip down to "View on the Week." If not, then this first part is a great play-by-play recap for the week. Click the daily charts for more detail on sectors, indexes, and market leaders each day.
-=x=-=x=-=x=-=x=-=x=-=x=-=x=-
Monday, August 2, 2021

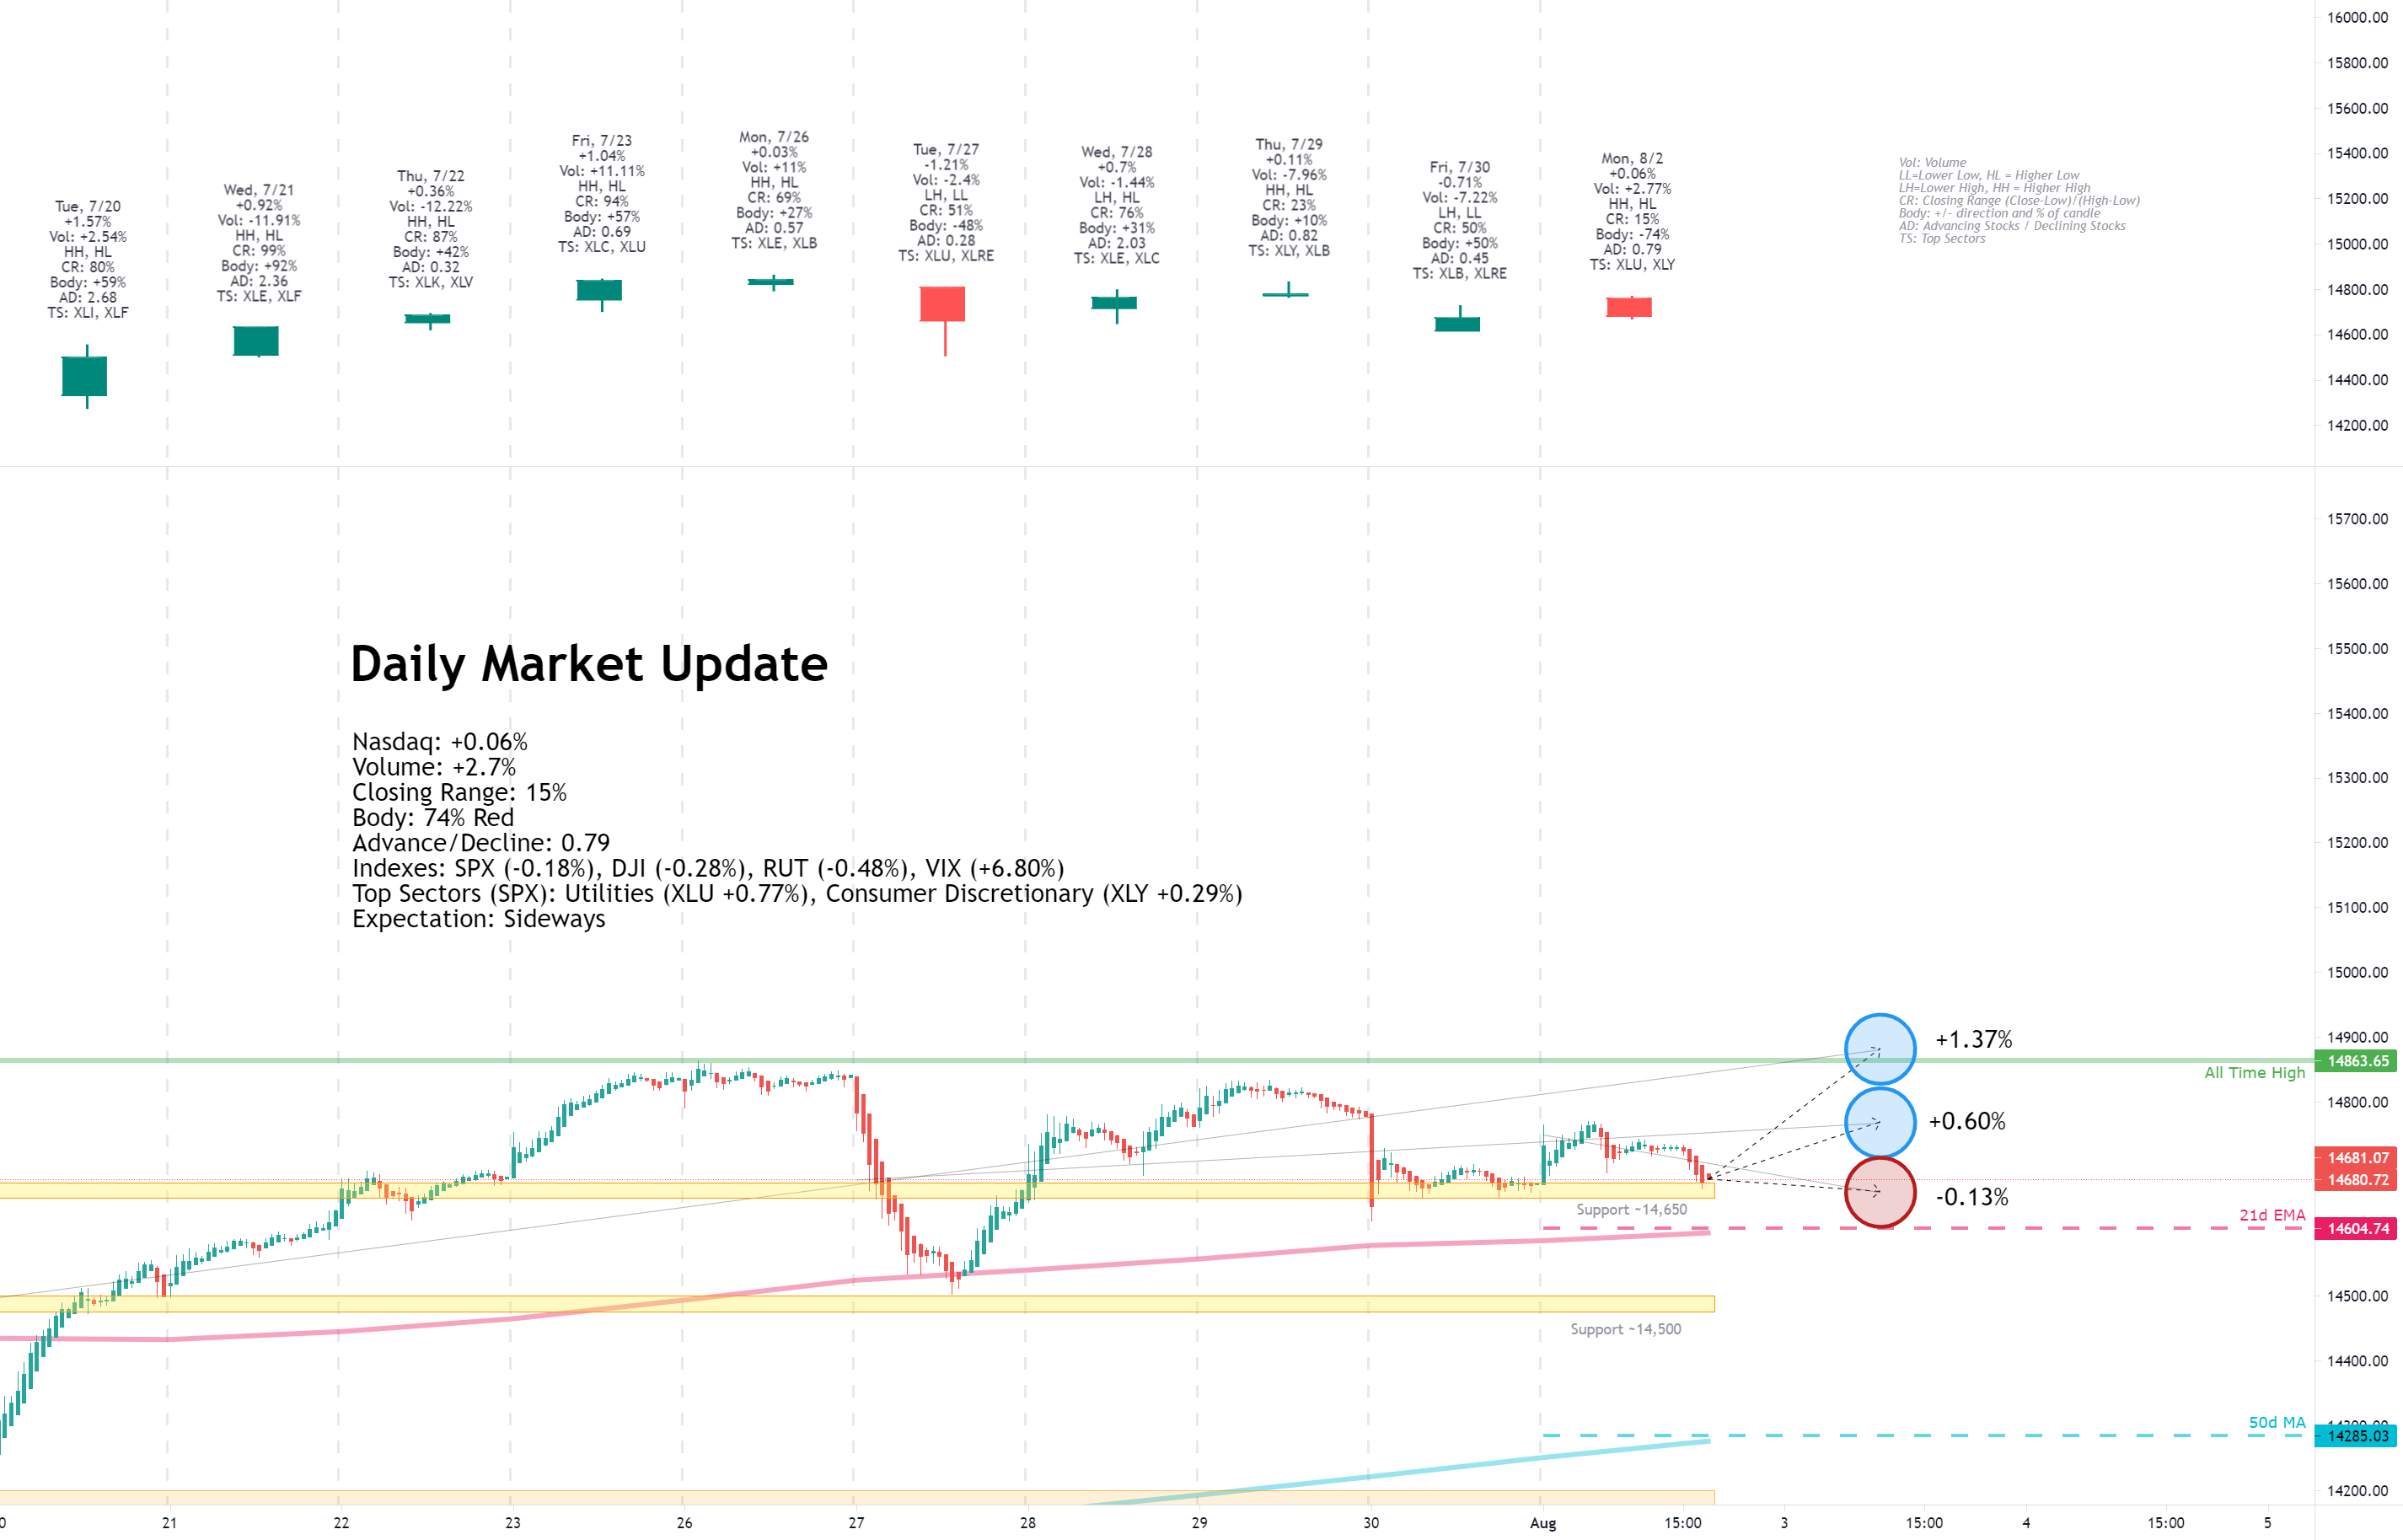
Facts: +0.06%, Volume higher, Closing range: 15%, Body: 74%
Good: Higher high, higher low, support at 14,650 area
Bad: Could not hold morning highs, low A/D ratio
Highs/Lows: Higher high, higher low
Candle: Mostly red body with tiny upper and lower wicks
Advanced/Decline: 0.79, more declining stocks than advancing stocks
Indexes: SPX (-0.18%), DJI (-0.28%), RUT (-0.48%), VIX (+6.80%)
Sectors: Utilities (XLU +0.77%) and Consumer Discretionary (XLY +0.29%) at the top. Energy (XLE -0.75%) and Materials (XLB -1.21%) at the bottom.
Expectation: Sideways
Despite being at a historically high level, Manufacturing activity data was lower than the previous month and lower than expectations. The result was a failed morning rally that took indexes higher before selling off in the afternoon. The only positive holding back more selling was the progress of the Infrastructure bill in congress.
The Nasdaq finished the day with a +0.06% gain on higher volume than the previous day. The candle is mostly red body with tiny upper and lower wicks, reflecting the full day of selling after the markets opened higher in the morning. The closing range of 15% is below a 74% red body. There were more declining stocks than advancing stocks.
-=x=-=x=-=x=-=x=-=x=-=x=-=x=-
Tuesday, August 3, 2021
Facts: +0.55%, Volume higher, Closing range: 99%, Body: 26%
Good: High closing range, long lower wick as bulls come in after morning selling
Bad: Lower low, no support at 14,650
Highs/Lows: Lower high, lower low
Candle: Small green body above a long lower wick.
Advanced/Decline: 0.67, three declining stocks for every two advancing stocks
Indexes: SPX (+0.82%), DJI (+0.80%), RUT (+0.36%), VIX (-7.40%)
Sectors: Energy (XLE +1.71%) and Health (XLV +1.39%) at the top. Real Estate (XLRE +0.41%) and Communications (XLC -0.45%) at the bottom.
Expectation: Sideways or Higher
Investors shrugged off worries of the Coronavirus Delta variant and turned bullish on a robust earnings week. After a morning dip, indexes moved higher, with the S&P 500 getting another record close. Apple and Health stocks led the way.
The Nasdaq closed with a +0.55% after testing its 21d EMA in the opening hour. The candle has a long lower wick from the dip, but the index rallied the rest of the day to end with a 99% closing range above a small green body. The candlestick's pattern is a hanging man within an uptrend. Despite the afternoon rally, there were three declining stocks for every two advancing stocks. The hanging man and low A/D show the sellers are present in the market even as the indexes rose.
-=x=-=x=-=x=-=x=-=x=-=x=-=x=-
Wednesday, August 4, 2021
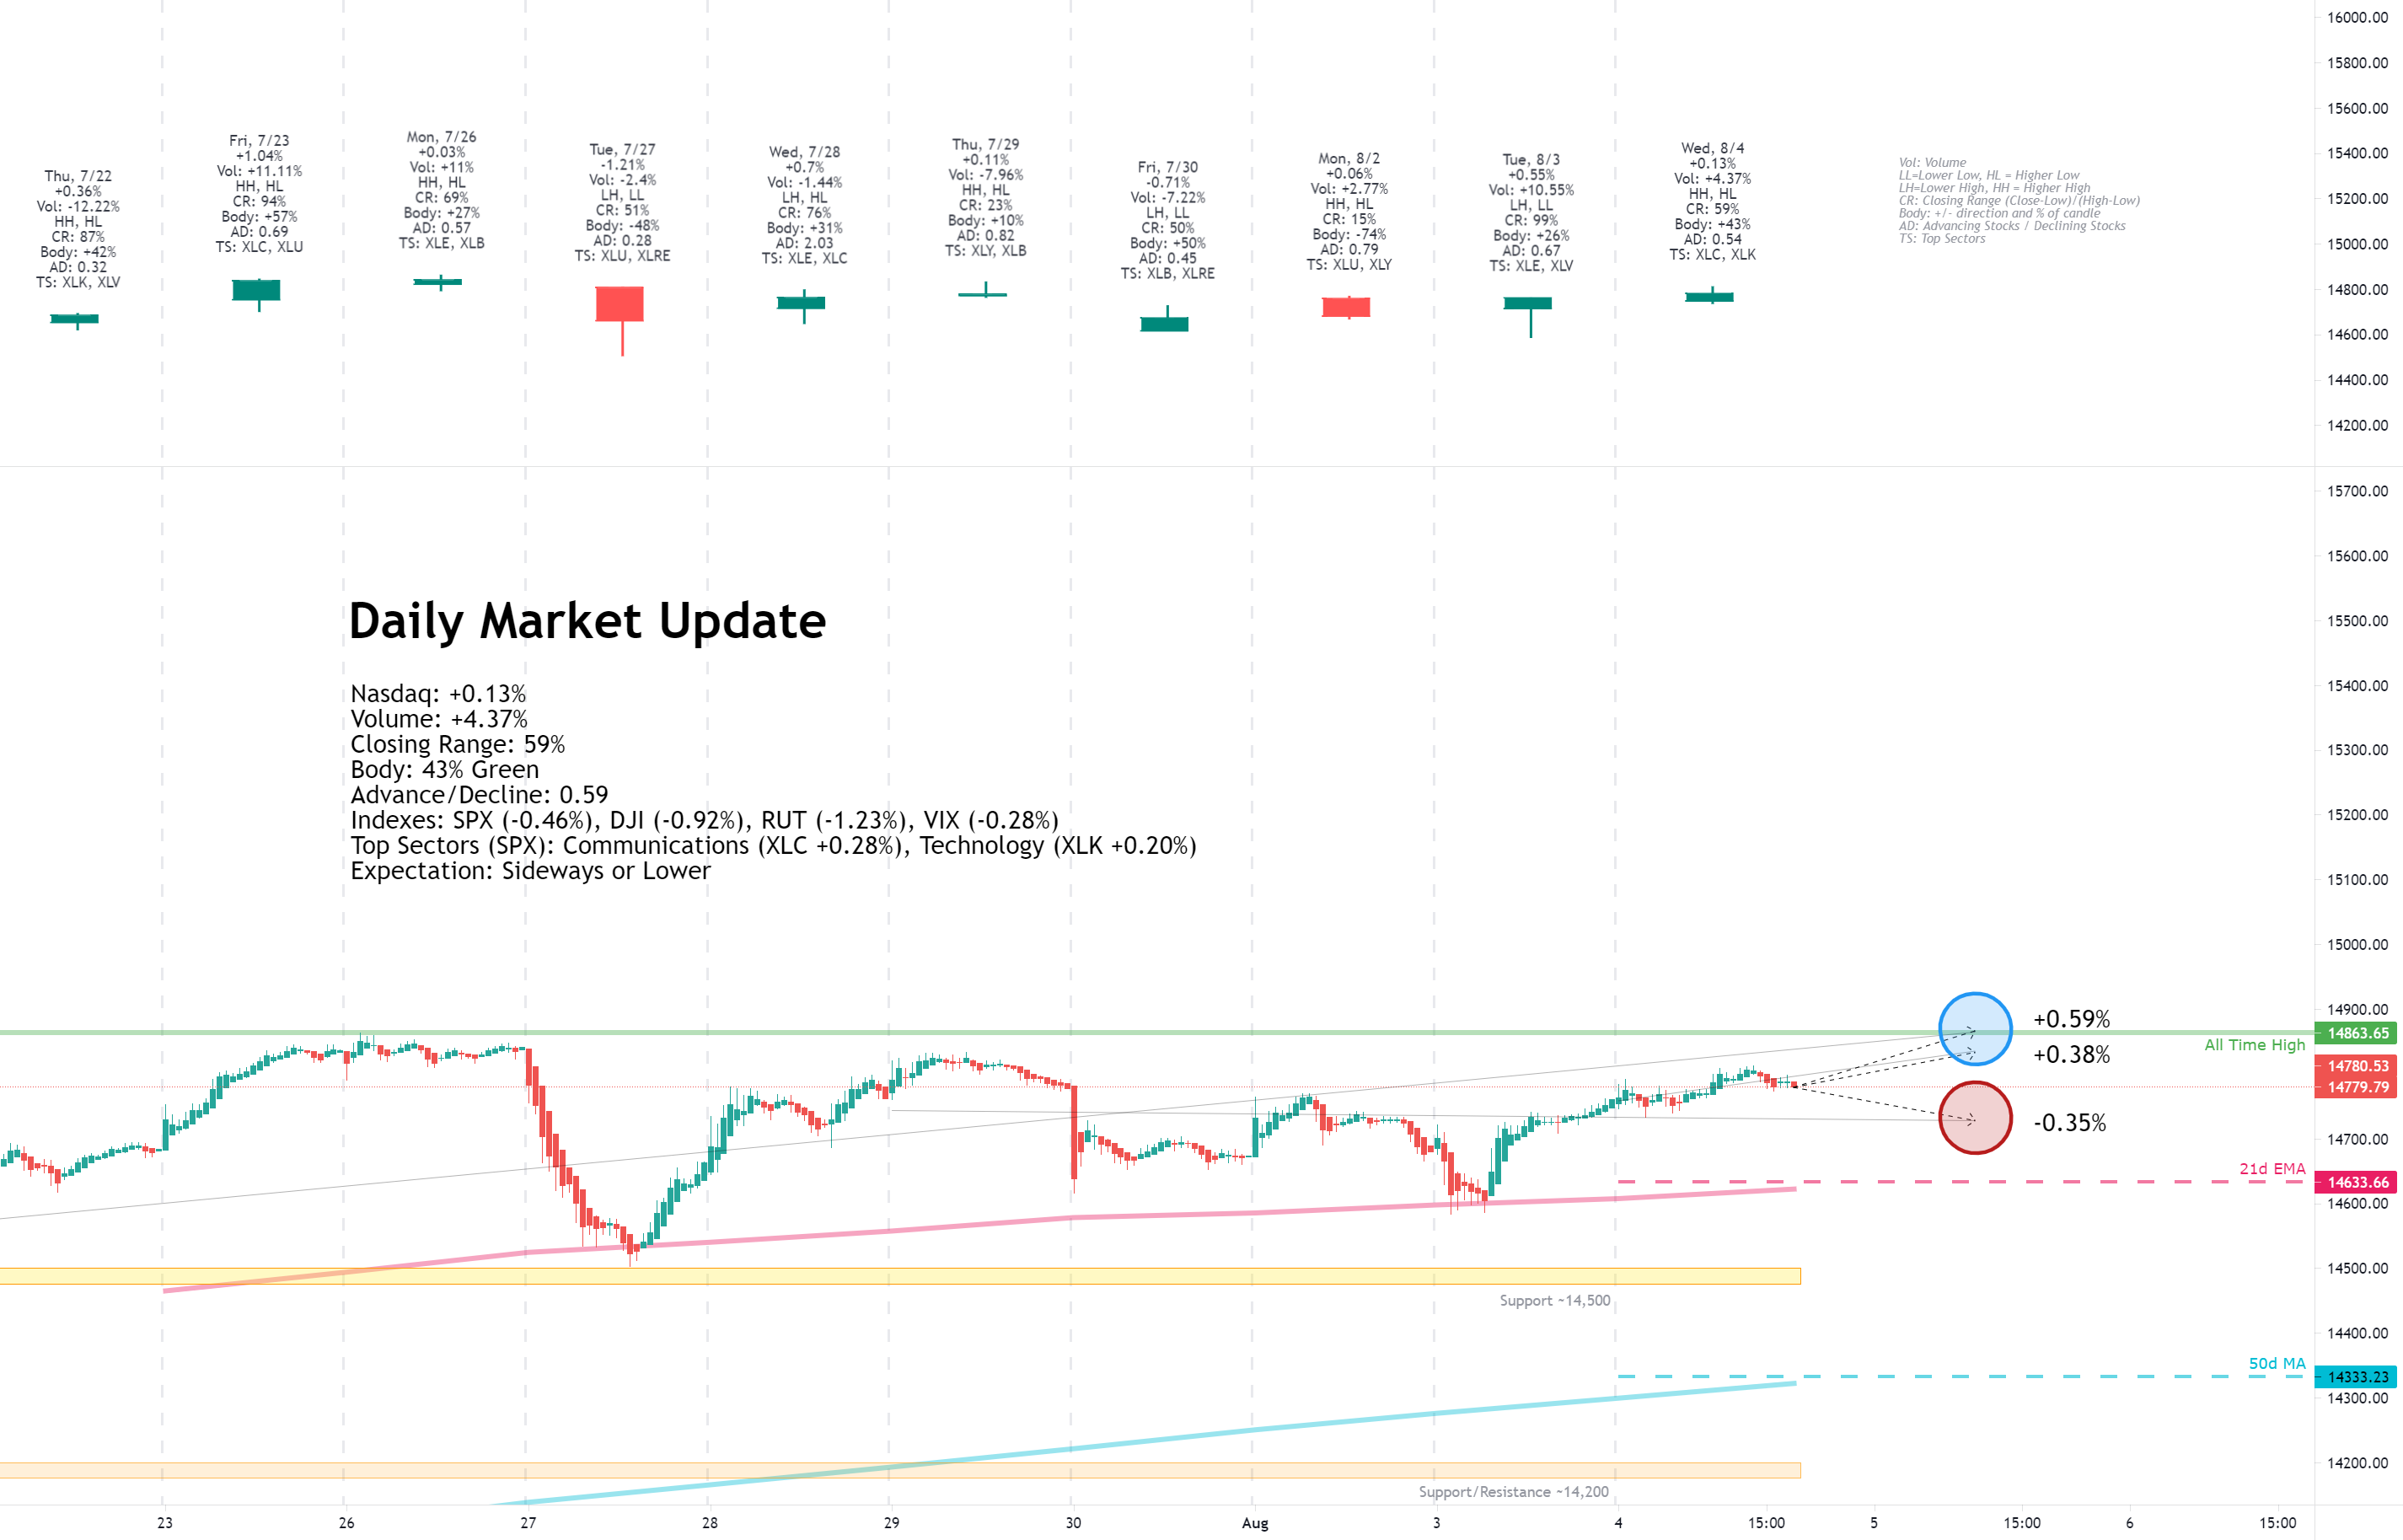
Facts: +0.13%, Volume higher, Closing range: 59%, Body: 43%
Good: Higher high/low, good closing range
Bad: Dip after intra-day high, low a/d ratio
Highs/Lows: Higher high, higher low
Candle: Over half green body, but in the lower part of the candle, longer upper wick
Advanced/Decline: 0.54, nearly two declining stocks for every advancing stock
Indexes: SPX (-0.46%), DJI (-0.92%), RUT (-1.23%), VIX (-0.28%)
Sectors: Communications (XLC +0.28%) and Technology (XLK +0.20%) at the top. Industrials (XLI -1.36%) and Energy (XLE -1.36%) at the bottom.
Expectation: Sideways or Lower
Only two sectors advanced today in a small gain for the Nasdaq while other major indexes took a step backward. Employment data disappointed investors already worried about the impact of the resurgence in the COVID pandemic, while the Fed's Clarida signaled possibly earlier tapering and interest rate hikes.
The Nasdaq ended the day with a +0.13%, but nearly two declining stocks for every advancing stock. The green body covers over half the candle, sitting near the bottom under a longer upper wick. The closing range of 59% is not bad but comes after a pullback from the intraday high on a worsening outlook. Volume was higher than the previous day.
-=x=-=x=-=x=-=x=-=x=-=x=-=x=-
Thursday, August 5, 2021
Facts: +0.78%, Volume lower, Closing range: 99%, Body: 84%
Good: Large green body, high closing range with good A/D ratio
Bad: Lower volume
Highs/Lows: Higher high, higher low
Candle: Large green body over a small lower wick, no upper wick
Advanced/Decline: 1.73, more than three advancing stocks for every declining stock
Indexes: SPX (+0.60%), DJI (+0.78%), RUT (+1.81%), VIX (-3.84%)
Sectors: Financials (XLF +1.31%) and Energy (XLE +1.13%) at the top. Materials (XLB -0.14%) and Health (XLV -0.41%) at the bottom.
Expectation: Sideways or Higher
The indexes set records again today after the morning jobless report came in better than expected. The anticipation of more positive news in Friday's employment data sent Treasury Yields and US equities higher.
The Nasdaq closed at a new record high with a +0.78% gain today. Volume was lower than the previous day. After breaking into a new record level, the index moved sideways for the afternoon before a rally into the close that left the candlestick with an 84% green body and 99% closing range. There were more than three stocks that advanced for every two stocks that declined.
-=x=-=x=-=x=-=x=-=x=-=x=-=x=-
Friday, August 6, 2021
Facts: -0.4%, Volume higher, Closing range: 46%, Body: 28%
Good: Higher low, support after morning rotation dip
Bad: Higher volume pullback from all time high
Highs/Lows: Lower high, higher low
Candle: Inside day with small red body in upper half of candle
Advanced/Decline: 0.84, more declining stocks than advancing stocks
Indexes: SPX (+0.17%), DJI (+0.41%), RUT (+0.53%), VIX (-6.54%)
Sectors: Financials (XLF +2.02%) and Materials (XLE +1.45%) at the top. Real Estate (XLRE -0.17%) and Consumer Discretionary (XLY -0.68%) at the bottom.
Expectation: Sideways or Higher
The S&P 500 and Dow Jones closed at new record highs while the Nasdaq pulled back in a rotation from growth to cyclical sectors. Positive employment data in the morning added to the possibility of agreement on a $1 trillion infrastructure bill that pushed investors towards the cyclical sectors.
The Nasdaq declined -0.4% for the day on higher volume than the previous day. The 28% red body is high in the candle, with a longer lower wick than the upper wick, creating a 46% closing range. The lower high and higher low make an inside day. There were more declining stocks than advancing stocks on the Nasdaq, but more broadly, gaining stocks outnumbered losing stocks in the NYSE.
-=x=-=x=-=x=-=x=-=x=-=x=-=x=-
View on the Week
Where does the market want to go next? That is the question to be answered after a week of mixed economic news met with COVID fears and uncertainty around what's happening with the infrastructure bill and government debt. Equity markets set new record highs as Treasury yields rose, setting up a possible pivot for next week.
The week began with manufacturing data that showed a slowing economic recovery. While the markets opened with gains, the gains were given back throughout a day of selling. It didn't help that the Delta variant of COVID continues to grow wildly as local governments begin enforcing new rules to help deal with the resurgence in the pandemic.
Nonfarm Employment data from ADP on Wednesday came in lower than expected, adding to the worries. That sent yields lower on treasuries and sent indexes lower, although the Nasdaq held onto a gain for the day. That all changed over the next two days.
Thursday's weekly continuing jobless claims showed a change in the employment trend, surprising investors and setting up for more positive employment news on Friday. Treasury yields moved higher while the gap between long-term and short-term treasuries widened significantly, bringing back worries from February of a steepening yield curve. The result was a reversal of the big tech and growth trade back into cyclical stocks on Friday. The Nasdaq dropped while the other indexes moved higher, setting more records.
Adding to the momentum for cyclicals, the infrastructure bill is making progress in Congress and could see a vote as early as this weekend. There are still hurdles to overcome for the bill, and the government is still dealing with a possibly long fight over the debt ceiling.
Investors showed caution throughout the week, and reactions to earnings reports were massive. Solar Edge (SEDG) and DataDog (DDOG) had gains of over 15% following their positive earnings reports and improved guidance. On the other hand, Roku (ROKU) declined -10%, Lemonade (LMND) dropped -13%, Zynga lost -20%, and Fastly fell a massive -25%, after signaling caution for the remainder of the year in their earnings calls.
Robinhood (HOOD) hit the headlines as a new meme-stock with huge swings throughout the week. At one point, the recent IPO stock was up 140% for the week. It gave back a lot of those gains but still ended up 56% for the week.
The Nasdaq advanced +1.11% for the week, setting a new all-time high on Thursday. The higher high and higher low, as well as the 81% closing range, is a bullish week. However, the long lower wick shows that sellers were still present. On the daily chart, a rising wedge will meet up with additional resistance at 15,000 that may cause a pullback before moving higher. Volume was higher than the previous week.
The S&P 500 (SPX) and Dow Jones Industrial Average (DJI) closed the week at new records with +0.94% and +0.78% gains. The Russell 2000 (RUT) gained +0.97% for the week.
The VIX volatility declined -11.35% for the week.
Several sectors rallied into the lead throughout the week, but Financials ( XLF ) came from behind to end the week as the top sector. On Friday, the sector added 2% on top of gains earlier in the week. The rally came as employment data was better than expected, sending Treasury yields higher and brightening the prospects for big bank performance tied to the yields.
Utilities ( XLU ) enjoyed the top spot on Monday and early Tuesday, rallied again on Thursday, but fell to second place on Friday. The defensive sector shows investors were cautious throughout the week as indexes set new records amidst worries the rising Delta variant might pull back the economic recovery.
Health Services ( XLV ) took the lead spot on Wednesday, likely on the view that there will be an increased demand for vaccines and therapies that can handle the resurgence of the pandemic.
Consumer Staples ( XLP ) was the only sector to decline this week, putting it at the bottom of the sector list.
Yields for the US 30y, 10y, and 2y Treasuries all rose for the week. The yield curve steepened for the week, reversing a trend of a tightening gap between long-term and short-term yields.
Both High Yield Corporate Bond (HYG) and Investment Grade Bond (LQD) prices declined. The gap between junk bonds and treasury yields widened.
The US Dollar (DXY) advanced +0.75% for the week. Much of that gain came on Friday as investors reacted to solid employment data.
Silver (SILVER) declined -4.49%, and Gold (GOLD) declined -2.84%.
Crude Oil (CRUDEOIL1!) declined -7.63%.
Timber (WOOD) declined -0.39%.
Copper (COPPER1!) declined -2.55%.
Aluminum (ALI1!) declined -0.88% but remains near record highs.
-=x=-=x=-=x=-=x=-=x=-=x=-=x=-
Big Four Mega-caps
Microsoft (MSFT) had the biggest gain this week, advancing +1.60% as it nears a new all-time high. Alphabet (GOOGL) closed the week with a +0.75%, its highest weekly close on record. Amazon (AMZN) gained +0.52%, recovering some from last week's massive drop. Apple (AAPL) gained +0.19%. Only Amazon is trading below the 10w moving average.
-=x=-=x=-=x=-=x=-=x=-=x=-=x=-
The Four Recovery Stocks
I picked four recovery stocks to track against the indexes and other indicators in this weekly report. Three of the four had gains this week. Carnival Cruise Lines (CCL) soared +6.61% for the week, although it is still well below the 10w and 40w moving average lines. Delta Airlines (DAL) gained +1.05%. Exxon Mobil (XOM) climbed by +0.50%. Marriott (MAR) dropped -3.01% for the week but closed above both moving average lines.
-=x=-=x=-=x=-=x=-=x=-=x=-=x=-
Cryptocurrency
I started tracking four major cryptocurrencies on the week in review. The four are Bitcoin, Ethereum, Litecoin, and Bitcoin Cash. The latter two are not the largest by market cap but seem to be well-known and are part of the CIX capital.com index, tracking five cryptocurrencies, including these four (Ripple is the fifth).
Ethereum (ETHUSD) continues to outperform the other three with a +22.00% gain this week. Bitcoin (BTCUSD) gained +10.76%. Litecoin (LTCUSD) and Bitcoin Cash (BCHUSD) are still trading near or below moving averages despite gaining +9.25% and +8.94% this week.
-=x=-=x=-=x=-=x=-=x=-=x=-=x=-
Investor Sentiment
The put/call ratio (PCCE) ended the week at 0.713.
The CNN Fear & Greed Index ended the week in the middle of the Fear range after dipping into Extreme Fear earlier in the week.
The NAAIM money manager exposure index rose to 97.72.
-=x=-=x=-=x=-=x=-=x=-=x=-=x=-
The Week Ahead
There are a lot of earnings reports, and I won't try to list them all here. Check your portfolio for earnings events to prevent surprises.
Monday
Next week will open with the JOLTs Job Openings data on Monday morning.
BioNTech (BNTX), Trade Desk (TTD), Tyson Foods (TSN), AMC Entertainment (AMC), Chegg (CHGG), Cable One (CABO), Curaleaf (CURLF), Tilray (TLRY), Xpel (XPEL), Rocket Pharma (RCKT), SUMO Logic (SUMO), and Vuzix (VUZI) are some of the companies opening up another busy earnings week with reports on Monday.
Tuesday
Nonfarm Productivity and Unit Labor Costs data will be available Tuesday morning, while Weekly Crude Oil Stock will get an update after the market closes.
Earnings reports for Tuesday include Coinbase (COIN), Unity Software (U), Upstart (UPST), and Open Lending (LPRO).
Wednesday
We'll get another look at inflation data on Wednesday with an update to the Consumer Price Index data in the morning. Crude Oil Inventories will come after the market opens. There is a 10y Treasury Note auction in the afternoon.
Nio (NIO), eBay (EBAY), Opendoor (OPEN), Bumble (BMBL), Wendy's (WEN), and Lordstown Motors (RIDE) release earnings on Wednesday.
Thursday
The Produce Price Index data publishes on Thursday. We'll also get an update of Jobless Claims data that surprised investors last week.
Wednesday's earnings reports include Walt Disney (DIS), Airbnb (BNB), DoorDash (DAH), Baidu (BIDU), Palantir (PLTR), Xpeng (XPEV), and LifeMD (LFMD).
Friday
Export and Import Price index data will wrap up the week's inflation data, while Consumer Sentiment data will give a reading on how consumers are weathering the resurging pandemic.
There are no interesting earnings reports for the daily update on Friday.
-=x=-=x=-=x=-=x=-=x=-=x=-=x=-
The Bullish Side
Economic data this week suggested businesses are pushing forward with the recovery despite a resurgence in COVID cases due to the Delta variant. That suggests we're learning to deal with the rise in cases through new protocols that allow businesses to stay open and consumers to continue spending. Unemployment is dropping as companies hire back workers to meet demand. An increase in both business and leisure travel is putting a strain on recovering airlines. Consumer debt is growing again.
The One Trillion Dollar Infrastructure Bill is making good progress in Congress with just a few issues remaining before it goes to a vote, possibly this weekend or early next week. The passage of the bill will boost several sectors, including renewable energy, communications, materials, and industrials.
-=x=-=x=-=x=-=x=-=x=-=x=-=x=-
The Bearish Side
The sudden rise in Treasury yields on Thursday and Friday steepened the yield curve once again. The curve was steadily flattening since hitting its sharpest level in March. While some increase in Treasury Yields is maybe ok, a rapid increase like we saw earlier this year, as Biden took over, would bring back yield curve fears that drove corrections for the Nasdaq in February and April.
The rising yields come as the government is beginning a long fight over the government debt ceiling. If the ceiling is met, the government will need to partially or wholly shut down and not issue new treasuries. The result will be volatility in the Treasuries market that will extend to equities that are so stretched at all-time highs that the impact could be a significant correction.
Expect lots of caution among investors as the drama plays out in Washington.
-=x=-=x=-=x=-=x=-=x=-=x=-=x=-
Key Nasdaq Levels to Watch
The Nasdaq set another all-time high this week but dipped below the 21d EMA in the process. There is a rising wedge pattern that will meet up with expected resistance at 15,000. Watch for a breakout from the wedge in either direction.
On the positive side, the levels are:
On the downside, there are a few key levels:
-=x=-=x=-=x=-=x=-=x=-=x=-=x=-
Wrap-up
We continue to see these mini-cycles play out where the market rotates through cyclicals, growth, and defensive sectors while it tries to navigate an unchartered recovery from the worst global economic disaster in history.
To get an idea of investments moving around, you can look at the sector rotations. I'll also leave with two charts.
The first compares Growth to Value performance. It's easy to see the cycles play out here in January, May, and this Summer. As treasury yields move higher, we may see another move toward value investments.
The second chart is Small-cap vs. Large-cap stocks. Here, you can see the considerable outperformance of small-caps in the last part of 2020, which played out until Treasury Yields started coming back down in March. With the possibility of more volatility in Treasuries, we may see another base in this chart, if not a turn back to the outperformance of small caps.
There are no predictions here. Just observations, watching and learning.
Good luck, stay healthy, and trade safe!
Notes
- The Market Week in Review is my weekend homework where I look over what happened in the previous week and what might come in the next week.
- I occasionally have some errors or typos and will correct them in my blog or the comments on TradingView. I do not have an editor and do this in my free time.
- If you find this helpful, please let me know in the comments. I am also more than happy to add new perspectives and data points if you have ideas.
The structure is the following:
- A recap of the daily updates that I do here on TradingView.
- View on the past week
- What's coming in the next week
- The Bullish View, The Bearish View
- Key index levels to watch out for
- Wrap-up
If you have been following my daily updates, you can skip down to "View on the Week." If not, then this first part is a great play-by-play recap for the week. Click the daily charts for more detail on sectors, indexes, and market leaders each day.
-=x=-=x=-=x=-=x=-=x=-=x=-=x=-
Monday, August 2, 2021
Facts: +0.06%, Volume higher, Closing range: 15%, Body: 74%
Good: Higher high, higher low, support at 14,650 area
Bad: Could not hold morning highs, low A/D ratio
Highs/Lows: Higher high, higher low
Candle: Mostly red body with tiny upper and lower wicks
Advanced/Decline: 0.79, more declining stocks than advancing stocks
Indexes: SPX (-0.18%), DJI (-0.28%), RUT (-0.48%), VIX (+6.80%)
Sectors: Utilities (XLU +0.77%) and Consumer Discretionary (XLY +0.29%) at the top. Energy (XLE -0.75%) and Materials (XLB -1.21%) at the bottom.
Expectation: Sideways
Despite being at a historically high level, Manufacturing activity data was lower than the previous month and lower than expectations. The result was a failed morning rally that took indexes higher before selling off in the afternoon. The only positive holding back more selling was the progress of the Infrastructure bill in congress.
The Nasdaq finished the day with a +0.06% gain on higher volume than the previous day. The candle is mostly red body with tiny upper and lower wicks, reflecting the full day of selling after the markets opened higher in the morning. The closing range of 15% is below a 74% red body. There were more declining stocks than advancing stocks.
-=x=-=x=-=x=-=x=-=x=-=x=-=x=-
Tuesday, August 3, 2021

Facts: +0.55%, Volume higher, Closing range: 99%, Body: 26%
Good: High closing range, long lower wick as bulls come in after morning selling
Bad: Lower low, no support at 14,650
Highs/Lows: Lower high, lower low
Candle: Small green body above a long lower wick.
Advanced/Decline: 0.67, three declining stocks for every two advancing stocks
Indexes: SPX (+0.82%), DJI (+0.80%), RUT (+0.36%), VIX (-7.40%)
Sectors: Energy (XLE +1.71%) and Health (XLV +1.39%) at the top. Real Estate (XLRE +0.41%) and Communications (XLC -0.45%) at the bottom.
Expectation: Sideways or Higher
Investors shrugged off worries of the Coronavirus Delta variant and turned bullish on a robust earnings week. After a morning dip, indexes moved higher, with the S&P 500 getting another record close. Apple and Health stocks led the way.
The Nasdaq closed with a +0.55% after testing its 21d EMA in the opening hour. The candle has a long lower wick from the dip, but the index rallied the rest of the day to end with a 99% closing range above a small green body. The candlestick's pattern is a hanging man within an uptrend. Despite the afternoon rally, there were three declining stocks for every two advancing stocks. The hanging man and low A/D show the sellers are present in the market even as the indexes rose.
-=x=-=x=-=x=-=x=-=x=-=x=-=x=-
Wednesday, August 4, 2021
Facts: +0.13%, Volume higher, Closing range: 59%, Body: 43%
Good: Higher high/low, good closing range
Bad: Dip after intra-day high, low a/d ratio
Highs/Lows: Higher high, higher low
Candle: Over half green body, but in the lower part of the candle, longer upper wick
Advanced/Decline: 0.54, nearly two declining stocks for every advancing stock
Indexes: SPX (-0.46%), DJI (-0.92%), RUT (-1.23%), VIX (-0.28%)
Sectors: Communications (XLC +0.28%) and Technology (XLK +0.20%) at the top. Industrials (XLI -1.36%) and Energy (XLE -1.36%) at the bottom.
Expectation: Sideways or Lower
Only two sectors advanced today in a small gain for the Nasdaq while other major indexes took a step backward. Employment data disappointed investors already worried about the impact of the resurgence in the COVID pandemic, while the Fed's Clarida signaled possibly earlier tapering and interest rate hikes.
The Nasdaq ended the day with a +0.13%, but nearly two declining stocks for every advancing stock. The green body covers over half the candle, sitting near the bottom under a longer upper wick. The closing range of 59% is not bad but comes after a pullback from the intraday high on a worsening outlook. Volume was higher than the previous day.
-=x=-=x=-=x=-=x=-=x=-=x=-=x=-
Thursday, August 5, 2021

Facts: +0.78%, Volume lower, Closing range: 99%, Body: 84%
Good: Large green body, high closing range with good A/D ratio
Bad: Lower volume
Highs/Lows: Higher high, higher low
Candle: Large green body over a small lower wick, no upper wick
Advanced/Decline: 1.73, more than three advancing stocks for every declining stock
Indexes: SPX (+0.60%), DJI (+0.78%), RUT (+1.81%), VIX (-3.84%)
Sectors: Financials (XLF +1.31%) and Energy (XLE +1.13%) at the top. Materials (XLB -0.14%) and Health (XLV -0.41%) at the bottom.
Expectation: Sideways or Higher
The indexes set records again today after the morning jobless report came in better than expected. The anticipation of more positive news in Friday's employment data sent Treasury Yields and US equities higher.
The Nasdaq closed at a new record high with a +0.78% gain today. Volume was lower than the previous day. After breaking into a new record level, the index moved sideways for the afternoon before a rally into the close that left the candlestick with an 84% green body and 99% closing range. There were more than three stocks that advanced for every two stocks that declined.
-=x=-=x=-=x=-=x=-=x=-=x=-=x=-
Friday, August 6, 2021

Facts: -0.4%, Volume higher, Closing range: 46%, Body: 28%
Good: Higher low, support after morning rotation dip
Bad: Higher volume pullback from all time high
Highs/Lows: Lower high, higher low
Candle: Inside day with small red body in upper half of candle
Advanced/Decline: 0.84, more declining stocks than advancing stocks
Indexes: SPX (+0.17%), DJI (+0.41%), RUT (+0.53%), VIX (-6.54%)
Sectors: Financials (XLF +2.02%) and Materials (XLE +1.45%) at the top. Real Estate (XLRE -0.17%) and Consumer Discretionary (XLY -0.68%) at the bottom.
Expectation: Sideways or Higher
The S&P 500 and Dow Jones closed at new record highs while the Nasdaq pulled back in a rotation from growth to cyclical sectors. Positive employment data in the morning added to the possibility of agreement on a $1 trillion infrastructure bill that pushed investors towards the cyclical sectors.
The Nasdaq declined -0.4% for the day on higher volume than the previous day. The 28% red body is high in the candle, with a longer lower wick than the upper wick, creating a 46% closing range. The lower high and higher low make an inside day. There were more declining stocks than advancing stocks on the Nasdaq, but more broadly, gaining stocks outnumbered losing stocks in the NYSE.
-=x=-=x=-=x=-=x=-=x=-=x=-=x=-
View on the Week
Where does the market want to go next? That is the question to be answered after a week of mixed economic news met with COVID fears and uncertainty around what's happening with the infrastructure bill and government debt. Equity markets set new record highs as Treasury yields rose, setting up a possible pivot for next week.
The week began with manufacturing data that showed a slowing economic recovery. While the markets opened with gains, the gains were given back throughout a day of selling. It didn't help that the Delta variant of COVID continues to grow wildly as local governments begin enforcing new rules to help deal with the resurgence in the pandemic.
Nonfarm Employment data from ADP on Wednesday came in lower than expected, adding to the worries. That sent yields lower on treasuries and sent indexes lower, although the Nasdaq held onto a gain for the day. That all changed over the next two days.
Thursday's weekly continuing jobless claims showed a change in the employment trend, surprising investors and setting up for more positive employment news on Friday. Treasury yields moved higher while the gap between long-term and short-term treasuries widened significantly, bringing back worries from February of a steepening yield curve. The result was a reversal of the big tech and growth trade back into cyclical stocks on Friday. The Nasdaq dropped while the other indexes moved higher, setting more records.
Adding to the momentum for cyclicals, the infrastructure bill is making progress in Congress and could see a vote as early as this weekend. There are still hurdles to overcome for the bill, and the government is still dealing with a possibly long fight over the debt ceiling.
Investors showed caution throughout the week, and reactions to earnings reports were massive. Solar Edge (SEDG) and DataDog (DDOG) had gains of over 15% following their positive earnings reports and improved guidance. On the other hand, Roku (ROKU) declined -10%, Lemonade (LMND) dropped -13%, Zynga lost -20%, and Fastly fell a massive -25%, after signaling caution for the remainder of the year in their earnings calls.
Robinhood (HOOD) hit the headlines as a new meme-stock with huge swings throughout the week. At one point, the recent IPO stock was up 140% for the week. It gave back a lot of those gains but still ended up 56% for the week.
The Nasdaq advanced +1.11% for the week, setting a new all-time high on Thursday. The higher high and higher low, as well as the 81% closing range, is a bullish week. However, the long lower wick shows that sellers were still present. On the daily chart, a rising wedge will meet up with additional resistance at 15,000 that may cause a pullback before moving higher. Volume was higher than the previous week.
The S&P 500 (SPX) and Dow Jones Industrial Average (DJI) closed the week at new records with +0.94% and +0.78% gains. The Russell 2000 (RUT) gained +0.97% for the week.
The VIX volatility declined -11.35% for the week.

Several sectors rallied into the lead throughout the week, but Financials ( XLF ) came from behind to end the week as the top sector. On Friday, the sector added 2% on top of gains earlier in the week. The rally came as employment data was better than expected, sending Treasury yields higher and brightening the prospects for big bank performance tied to the yields.
Utilities ( XLU ) enjoyed the top spot on Monday and early Tuesday, rallied again on Thursday, but fell to second place on Friday. The defensive sector shows investors were cautious throughout the week as indexes set new records amidst worries the rising Delta variant might pull back the economic recovery.
Health Services ( XLV ) took the lead spot on Wednesday, likely on the view that there will be an increased demand for vaccines and therapies that can handle the resurgence of the pandemic.
Consumer Staples ( XLP ) was the only sector to decline this week, putting it at the bottom of the sector list.
Yields for the US 30y, 10y, and 2y Treasuries all rose for the week. The yield curve steepened for the week, reversing a trend of a tightening gap between long-term and short-term yields.
Both High Yield Corporate Bond (HYG) and Investment Grade Bond (LQD) prices declined. The gap between junk bonds and treasury yields widened.
The US Dollar (DXY) advanced +0.75% for the week. Much of that gain came on Friday as investors reacted to solid employment data.
Silver (SILVER) declined -4.49%, and Gold (GOLD) declined -2.84%.
Crude Oil (CRUDEOIL1!) declined -7.63%.
Timber (WOOD) declined -0.39%.
Copper (COPPER1!) declined -2.55%.
Aluminum (ALI1!) declined -0.88% but remains near record highs.
-=x=-=x=-=x=-=x=-=x=-=x=-=x=-
Big Four Mega-caps
Microsoft (MSFT) had the biggest gain this week, advancing +1.60% as it nears a new all-time high. Alphabet (GOOGL) closed the week with a +0.75%, its highest weekly close on record. Amazon (AMZN) gained +0.52%, recovering some from last week's massive drop. Apple (AAPL) gained +0.19%. Only Amazon is trading below the 10w moving average.
-=x=-=x=-=x=-=x=-=x=-=x=-=x=-
The Four Recovery Stocks
I picked four recovery stocks to track against the indexes and other indicators in this weekly report. Three of the four had gains this week. Carnival Cruise Lines (CCL) soared +6.61% for the week, although it is still well below the 10w and 40w moving average lines. Delta Airlines (DAL) gained +1.05%. Exxon Mobil (XOM) climbed by +0.50%. Marriott (MAR) dropped -3.01% for the week but closed above both moving average lines.
-=x=-=x=-=x=-=x=-=x=-=x=-=x=-
Cryptocurrency
I started tracking four major cryptocurrencies on the week in review. The four are Bitcoin, Ethereum, Litecoin, and Bitcoin Cash. The latter two are not the largest by market cap but seem to be well-known and are part of the CIX capital.com index, tracking five cryptocurrencies, including these four (Ripple is the fifth).
Ethereum (ETHUSD) continues to outperform the other three with a +22.00% gain this week. Bitcoin (BTCUSD) gained +10.76%. Litecoin (LTCUSD) and Bitcoin Cash (BCHUSD) are still trading near or below moving averages despite gaining +9.25% and +8.94% this week.
-=x=-=x=-=x=-=x=-=x=-=x=-=x=-
Investor Sentiment
The put/call ratio (PCCE) ended the week at 0.713.
The CNN Fear & Greed Index ended the week in the middle of the Fear range after dipping into Extreme Fear earlier in the week.
The NAAIM money manager exposure index rose to 97.72.
-=x=-=x=-=x=-=x=-=x=-=x=-=x=-
The Week Ahead
There are a lot of earnings reports, and I won't try to list them all here. Check your portfolio for earnings events to prevent surprises.
Monday
Next week will open with the JOLTs Job Openings data on Monday morning.
BioNTech (BNTX), Trade Desk (TTD), Tyson Foods (TSN), AMC Entertainment (AMC), Chegg (CHGG), Cable One (CABO), Curaleaf (CURLF), Tilray (TLRY), Xpel (XPEL), Rocket Pharma (RCKT), SUMO Logic (SUMO), and Vuzix (VUZI) are some of the companies opening up another busy earnings week with reports on Monday.
Tuesday
Nonfarm Productivity and Unit Labor Costs data will be available Tuesday morning, while Weekly Crude Oil Stock will get an update after the market closes.
Earnings reports for Tuesday include Coinbase (COIN), Unity Software (U), Upstart (UPST), and Open Lending (LPRO).
Wednesday
We'll get another look at inflation data on Wednesday with an update to the Consumer Price Index data in the morning. Crude Oil Inventories will come after the market opens. There is a 10y Treasury Note auction in the afternoon.
Nio (NIO), eBay (EBAY), Opendoor (OPEN), Bumble (BMBL), Wendy's (WEN), and Lordstown Motors (RIDE) release earnings on Wednesday.
Thursday
The Produce Price Index data publishes on Thursday. We'll also get an update of Jobless Claims data that surprised investors last week.
Wednesday's earnings reports include Walt Disney (DIS), Airbnb (BNB), DoorDash (DAH), Baidu (BIDU), Palantir (PLTR), Xpeng (XPEV), and LifeMD (LFMD).
Friday
Export and Import Price index data will wrap up the week's inflation data, while Consumer Sentiment data will give a reading on how consumers are weathering the resurging pandemic.
There are no interesting earnings reports for the daily update on Friday.
-=x=-=x=-=x=-=x=-=x=-=x=-=x=-
The Bullish Side
Economic data this week suggested businesses are pushing forward with the recovery despite a resurgence in COVID cases due to the Delta variant. That suggests we're learning to deal with the rise in cases through new protocols that allow businesses to stay open and consumers to continue spending. Unemployment is dropping as companies hire back workers to meet demand. An increase in both business and leisure travel is putting a strain on recovering airlines. Consumer debt is growing again.
The One Trillion Dollar Infrastructure Bill is making good progress in Congress with just a few issues remaining before it goes to a vote, possibly this weekend or early next week. The passage of the bill will boost several sectors, including renewable energy, communications, materials, and industrials.
-=x=-=x=-=x=-=x=-=x=-=x=-=x=-
The Bearish Side
The sudden rise in Treasury yields on Thursday and Friday steepened the yield curve once again. The curve was steadily flattening since hitting its sharpest level in March. While some increase in Treasury Yields is maybe ok, a rapid increase like we saw earlier this year, as Biden took over, would bring back yield curve fears that drove corrections for the Nasdaq in February and April.
The rising yields come as the government is beginning a long fight over the government debt ceiling. If the ceiling is met, the government will need to partially or wholly shut down and not issue new treasuries. The result will be volatility in the Treasuries market that will extend to equities that are so stretched at all-time highs that the impact could be a significant correction.
Expect lots of caution among investors as the drama plays out in Washington.
-=x=-=x=-=x=-=x=-=x=-=x=-=x=-
Key Nasdaq Levels to Watch
The Nasdaq set another all-time high this week but dipped below the 21d EMA in the process. There is a rising wedge pattern that will meet up with expected resistance at 15,000. Watch for a breakout from the wedge in either direction.
On the positive side, the levels are:
- The high of this past week was a new all-time high at 14,896.47.
- The round number 15,000 is likely to be a new area of resistance.
On the downside, there are a few key levels:
- The 10d MA is at 14,766.86.
- The 21d EMA is at 14,673.64.
- 14,584.09 is the low of the past week.
- 14,500 support area was tested this past week and held.
- The 50d MA is at 14,379.94.
- 14,200 remains a critical level that would signal a bearish double top.
- 14,000 has been an area of support/resistance.
- There is a pivot at 13,903.73, which would be a technical support area if a correction is in order.
- A further pullback would likely hit the 200d moving average at 13,361.02. The index hasn't approached this line since rising above it in April 2020.
-=x=-=x=-=x=-=x=-=x=-=x=-=x=-
Wrap-up
We continue to see these mini-cycles play out where the market rotates through cyclicals, growth, and defensive sectors while it tries to navigate an unchartered recovery from the worst global economic disaster in history.
To get an idea of investments moving around, you can look at the sector rotations. I'll also leave with two charts.
The first compares Growth to Value performance. It's easy to see the cycles play out here in January, May, and this Summer. As treasury yields move higher, we may see another move toward value investments.
The second chart is Small-cap vs. Large-cap stocks. Here, you can see the considerable outperformance of small-caps in the last part of 2020, which played out until Treasury Yields started coming back down in March. With the possibility of more volatility in Treasuries, we may see another base in this chart, if not a turn back to the outperformance of small caps.
There are no predictions here. Just observations, watching and learning.
Good luck, stay healthy, and trade safe!