Market Week in Review - 5/17/2021 - 5/21/2021
Summary: Are you tired of hearing about inflation yet? Well, it's still very much the focus of investors and driving the wild up-and-down movements in the Nasdaq. This week's most crucial moment was clearly on Wednesday at 2:00 pm when the Fed released the minutes from last month's meeting. Investors poured over the report looking between the lines for hints of inflation concerns and potential fed action to control it.
Notes
The structure is the following:
If you have been following my daily updates, you can skip down to "The Meaning of Life." If not, then this first part is a great play-by-play recap for the week. Click the daily charts for more detail on sectors, indexes, and market leaders each day.
-=x=-=x=-=x=-=x=-=x=-=x=-=x=-
Monday, May 17, 2021

Facts: -0.38%, Volume lower, Closing range: 85%, Body: 8%
Good: Close in upper part of range, bulls took over in afternoon
Bad: Lower high, selling most of day
Highs/Lows: Lower high, higher low
Candle: Tiny thin body over a long lower wick.
Advanced/Decline: More declining stocks than advancing stocks
Indexes: SPX (-0.25%), DJI (-0.16%), RUT (+0.11%), VIX (+4.84%)
Sectors: Energy (XLE +2.32%) and Materials (XLB +0.88%) were top. Communications (XLC -0.79%) and Utilities (XLU -0.82%) were bottom.
Expectation: Sideways or Higher
Monday started with a dip, just like the past several Mondays. This week's difference is that the bulls entered in the afternoon, bringing the major indices back to near their open. Small Caps performed best on the day as inflation still weighed on big tech and mid-cap growth.
The Nasdaq closed with a -0.38% loss on lower volume. The 85% closing range over an 8% green body is in the upper part of the candle over a long lower wick. The candle indicates the bulls weren't willing to let go, but still, there was indecision in the market. There were more declining stocks than advancing stocks.
-=x=-=x=-=x=-=x=-=x=-=x=-=x=-
Tuesday, May 18, 2021
Facts: -0.56%, Volume higher, Closing range: 2%, Body: 61%
Good: Higher high, higher low
Bad: Couldn't hold morning rally, closed day at low
Highs/Lows: Higher high, higher low
Candle: Red body under a long upper wick and almost no lower wick
Advanced/Decline: More declining stocks than advancing stocks
Indexes: SPX (-0.85%), DJI (-0.78%), RUT (-0.73%), VIX (+8.22%)
Sectors: Real Estate (XLRE +0.19%) and Health (XLV +0.03%) were top. Industrials (XLI -1.46%) and Energy (XLE -2.32%) were bottom.
Expectation: Sideways or Lower
Surprisingly robust earnings reports from big retail before market open sent major indices on a rally in the morning. Still, the bullish exuberance couldn't hold on, and the indices closed the day with losses. Despite the downward pressure on the indexes, the growth stock list had a relatively good day.
The Nasdaq closed with a -0.56% loss for the day but was able to turn in a higher high and higher low than the previous day. The index rose in the early morning but then fell the rest of the day, creating an upper wick in the morning but ending the day with a 2% closing range underneath a 61% red body. Volume was higher for the day, with intraday volume more elevated in the morning than in the afternoon. There were more declining stocks than advancing stocks.
-=x=-=x=-=x=-=x=-=x=-=x=-=x=-
Wednesday, May 19, 2021
Facts: -0.03%, Volume higher, Closing range: 2%, Body: 61%
Good: Thick green body shows buying after a gap down at open
Bad: Gap down at open
Highs/Lows: Lower high, lower low
Candle: All green body, barely visible upper and lower wicks
Advanced/Decline: Two declining stocks for every advancing stock
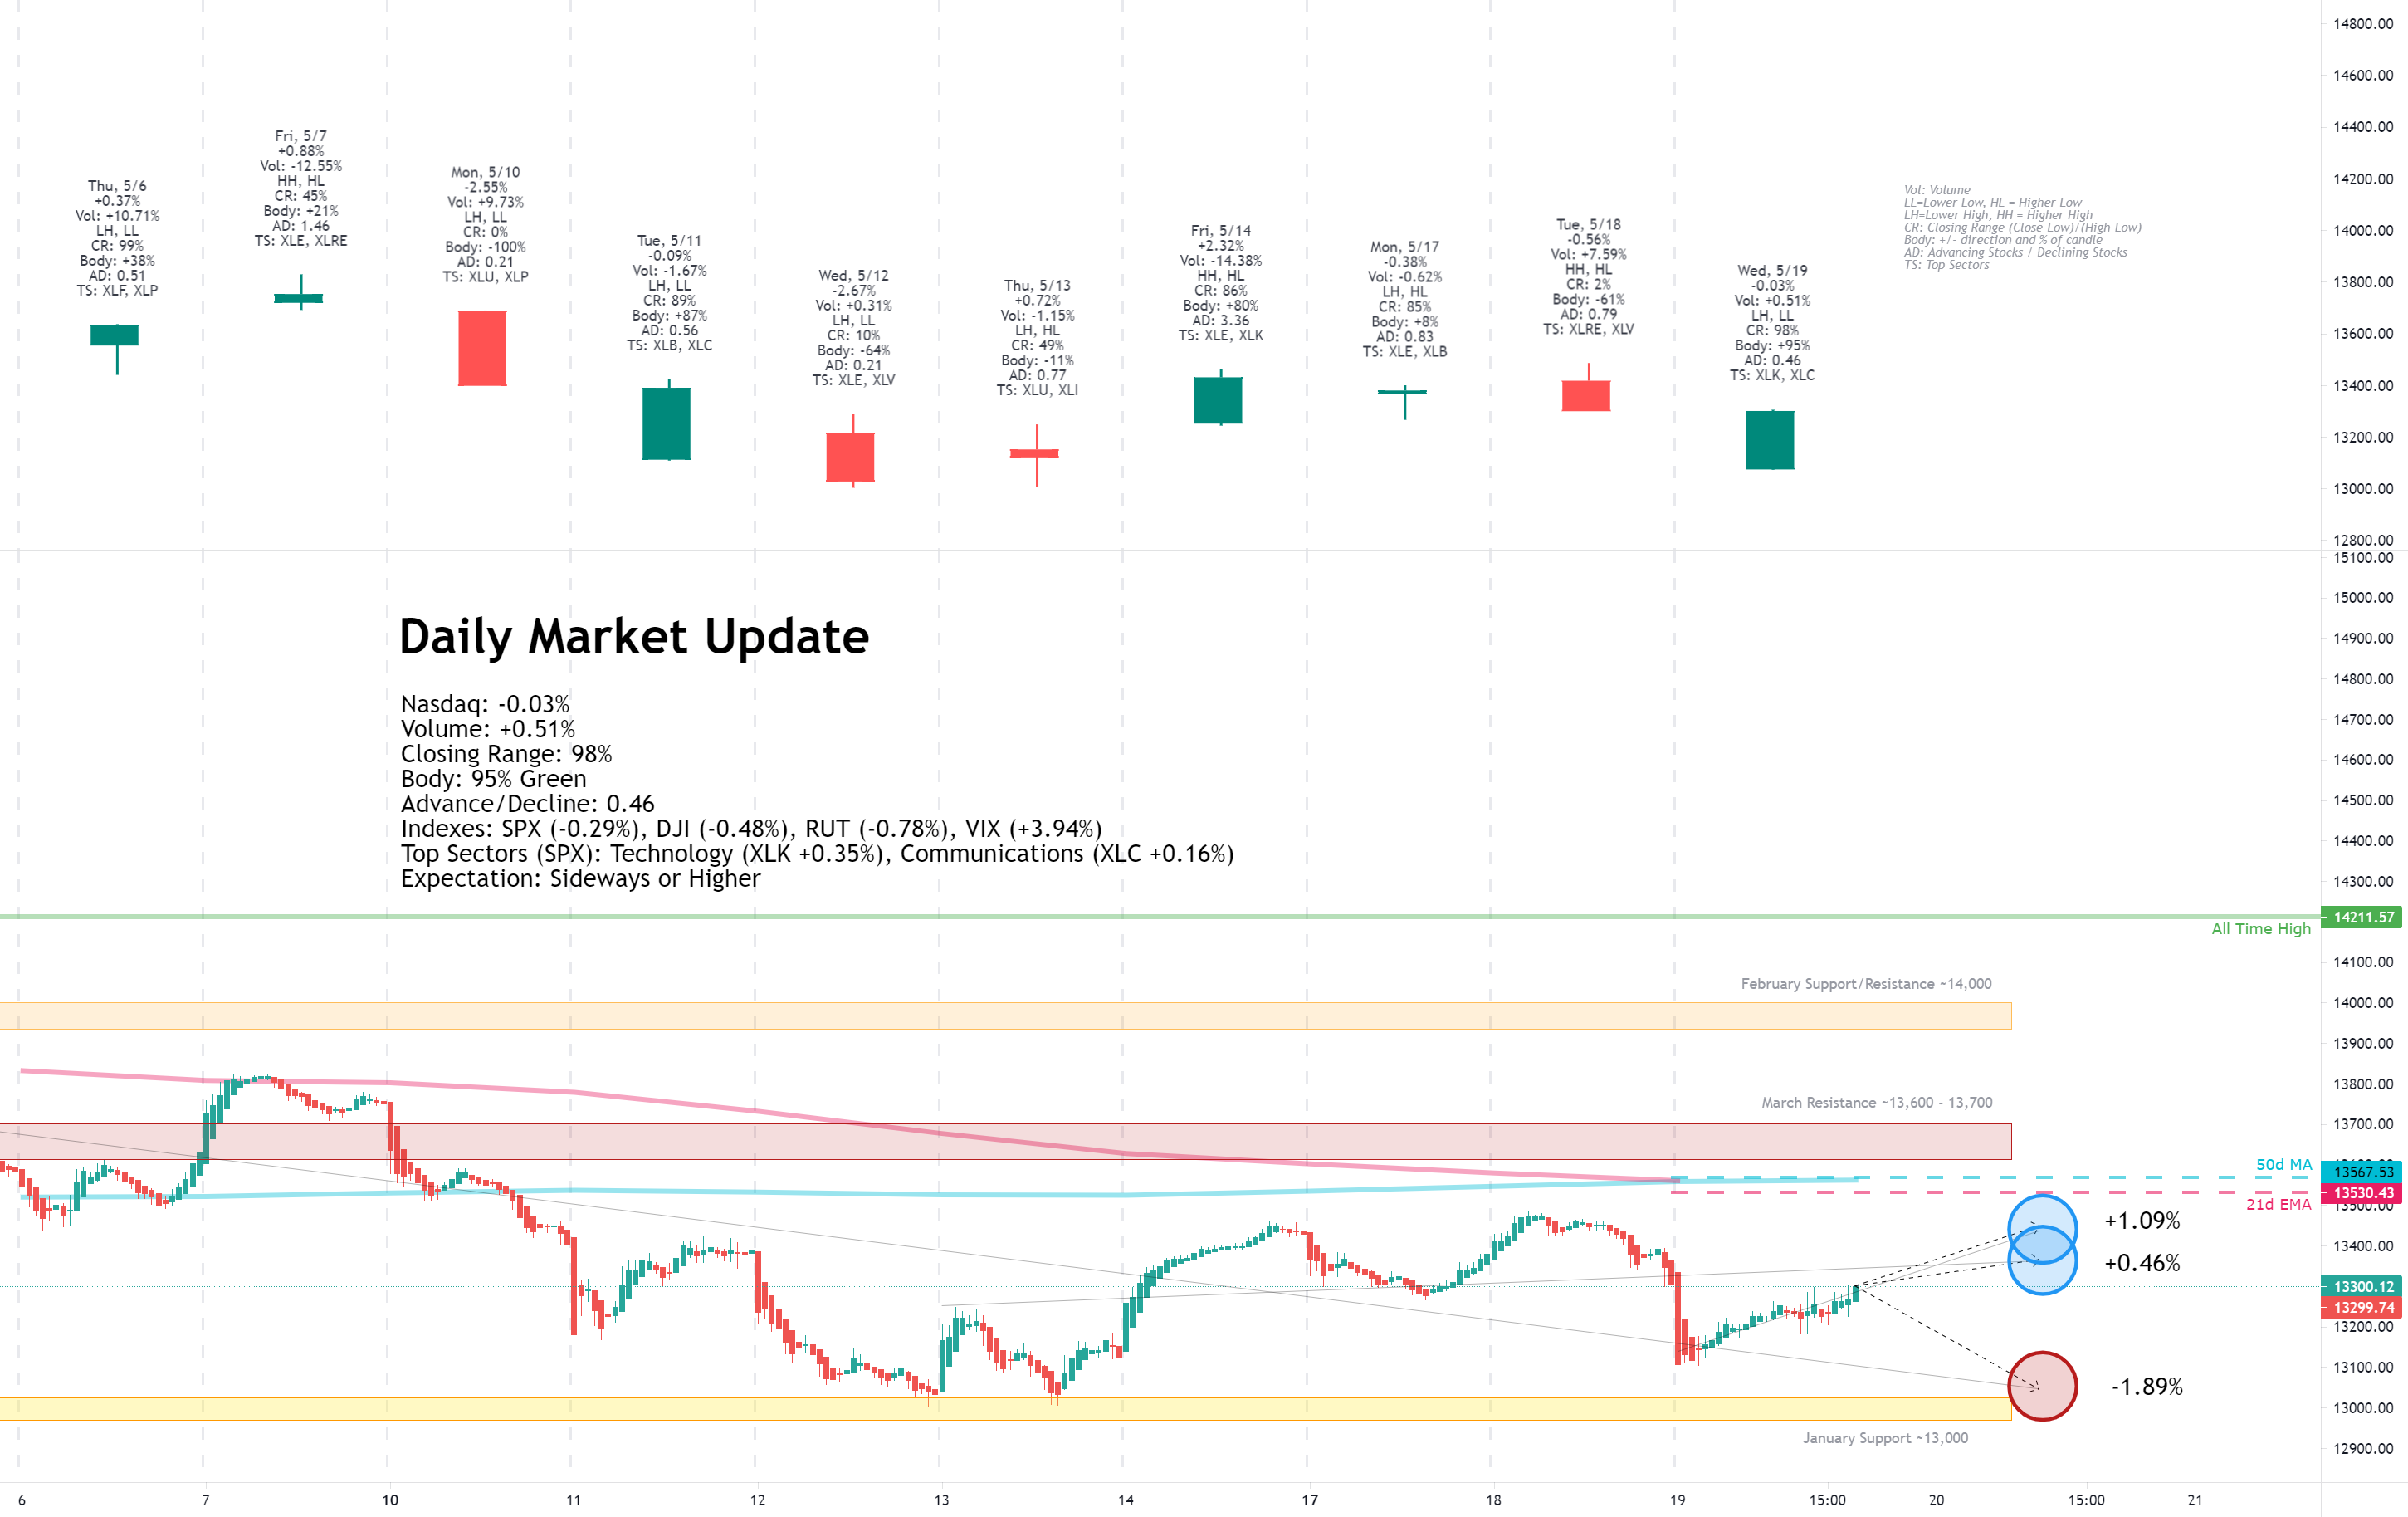
Indexes: SPX (-0.29%), DJI (-0.48%), RUT (-0.78%), VIX (+3.94%)
Sectors: Technology (XLK +0.35%) and Communications (XLC +0.16%) were top. Materials (XLB -1.53%) and Energy (XLE -2.49%)
Expectation: Sideways or Higher
You shake my nerves, and you rattle my brain! There is no question what investors worried about today. They took risk off the table at open ahead of the Fed minutes. Then morning comments from Fed member Quarles started to attract investors back in but at lowering volume. When the meeting minutes were released, volume popped back up as the market reacted.
The Nasdaq closed with a -0.03% loss, much better than the -1.71% dip at open. Volume was higher than the previous day. The 95% green body and 98% closing range shows the buying throughout the day. There is the potential, as with 5/11, that the gap down caused some shorts to cover and take profits. But much of the action seemed to be centered around the 2 pm release of the Fed minutes. There were two declining stocks for every advancing stock.
-=x=-=x=-=x=-=x=-=x=-=x=-=x=-
Thursday, May 20, 2021
Facts: +1.77%, Volume lower, Closing range: 89% (w/gap), Body: 86%
Good: No lower wick, thick green body with high closing range
Bad: Lower volume
Highs/Lows: Higher high, higher low
Candle: Gap up at open, mostly green body with a short upper wick
Advanced/Decline: Three advancing stocks for every two declining stocks
Indexes: SPX (+1.06%), DJI (+0.55%), RUT (+0.64%), VIX (-6.81%)
Sectors: Technology (XLK +1.91%) and Communications (XLC +1.71%) were top. Financials (XLF +0.05%) and Energy (XLE -0.15%) were bottom.
Expectation: Higher
A better-than-expected jobs report was enough to continue the trend in Technology and Communications stocks that started yesterday. Eyes remain on the Fed and inflation. Still, a drop in the US dollar and US treasury rates, in addition to lowering expectations from a few retailers, gave investors some relief that the economy was not overheating out of control.
The Nasdaq closed the day with a +1.77% advance. Volume was lower, but the gap-up and higher high and higher low are both great signs. With the gap, the closing range was 89%. An 86% green body sits under a short upper wick formed late in the date. There is no visible lower wick. There were three advancing stocks for every two declining stocks.
-=x=-=x=-=x=-=x=-=x=-=x=-=x=-
Friday, May 21, 2021
Facts: -0.48%, Volume lower, Closing range: 5%, Body: 95%
Good: Higher high, higher low, lower volume on down day
Bad: Selling throughout session, high at open, low near close
Highs/Lows: Higher high, higher low
Candle: Barely visible lower wick, no upper wick, mostly red body
Advanced/Decline: Slightly more declining than advancing stocks
Indexes: SPX (-0.08%), DJI (+0.36%), RUT (+0.34%), VIX (-2.52%)
Sectors: Financials (XLF +0.99%) and Utilities (XLU +0.52%) were top. Consumer Discretionary (XLY -0.50%) and Technology (XLK -0.55%) were bottom.
Expectation: Sideways
Big tech and growth stocks paused after two days of gains, while investors boosted recovery stocks after good economic data in the morning. The purchasing manager indexes for Manufacturing and Services were higher than expected, indicating an uptick in demand in both sectors.
The Nasdaq started the day in the positive but ended with a -0.48% decline after a full day of selling. Volume was lower than the previous day. The Nasdaq did put in a higher high and higher low than Thursday. However, the candle is an almost entirely red body, with a 5% closing range. There were slightly more declining stocks than advancing stocks.
-=x=-=x=-=x=-=x=-=x=-=x=-=x=-
The Meaning of Life (View on the Week)
Are you tired of hearing about inflation yet? Well, it's still very much the focus of investors and driving the wild up-and-down movements in the Nasdaq. This week's most crucial moment was clearly on Wednesday at 2:00 pm when the Fed released the minutes from last month's meeting. Investors poured over the report looking between the lines for hints of inflation concerns and potential fed action to control it.
On Monday and Tuesday, the Nasdaq retreated ahead of the Fed minutes release. Investors focused on cyclical sectors (XLE, XLB) on Monday and defensive sector sectors (XLRE, XLV, XLU) on Tuesday. The market opened with a gap down on Wednesday. Investors responded to the gap and slowly bought back stocks through the morning as volume dropped on the Nasdaq.
At the 2:00 pm release of the fed minutes, volume immediately picked back up, and a rally began that lasted through Thursday. The rally also came with a change in the sector list. The growth sectors of Technology (XLK) and Communications (XLC) led from Wednesday morning through Thursday.
On Friday, the growth sectors paused while some of the value plays had a chance to catch up. I'll include the Growth/Value chart that frequently shows up in the weekly review. In the chart, you can see the spike in growth relative to value on Wednesday and Thursday, with a slight retreat on Friday.
There is not enough for a trend yet. And there is still question of which way the market will go in the next few weeks. The first question is in this chart. Is this spike in growth vs. value an indication of a trend? Have popular growth stocks found a bottom and ready to climb again? Or is it merely a quick spike, and investors will move back to the value trade?
The Nasdaq advanced +0.31% on the lowest volume week thus far in 2021. The closing range of 73% is a good sign, while the inside week and thin green body show indecision in direction.
The other three major indices all declined for the week. The S&P 500 (SPX) lost -0.43%. The Dow Jones Industrial Average (DJI) declined -0.51%. The Russell 2000 (RUT) fell -0.42%.
The VIX volatility index closed the week with a +6.59% weekly gain.
Sector performance provides some clues this week on how investors are thinking about inflation and the Fed. Like the market character changed around the Wednesday release of the Fed meeting minutes, the sectors also saw a change in leadership. The question remains if that new character sticks for the coming weeks or gets disrupted as the inflation story unfolds.
Real Estate ( XLRE ), Health Care ( XLV ), and Utilities ( XLU ) top the list for the full week, and that reflects well the overall mood of investors. These sectors are used as defensive sectors. Regardless of whether economic conditions serve better cyclical stocks or growth stocks, the services in these defensive sectors are always required. Consumer Staples ( XLP ) is also up in that list and outperformed the S&P 500 index.
For the remaining sectors, it's worth looking at performance before and after the Wednesday Fed release. Coming into the week, there was a clear focus on cyclical sectors, with Energy ( XLE ) and Materials ( XLB ) leading on Monday. Investors turned defensive on Tuesday, popping the defensive sectors to the top. And then the gap down at open came on Wednesday with shifting investments on lower volume leading into the meeting minutes release at 2p.
After Wednesday, it's clear there was a change in sentiment. Technology ( XLK ) and Communications ( XLC ) came out of the gap-down and performed best through the end of the week, despite a small pullback for both on Friday. They performed well enough to end the week outperforming the S&P 500 index.
That leaves the cyclical sectors at the bottom of the list. Materials ( XLB ), Industrials ( XLI ), and Energy ( XLE ) were the bottom three sectors. For these sectors, much rests on Biden's infrastructure plans passing through congress, but the proposals continue to be rejected by Republicans. It's reasonable to expect that with continued headwinds for the infrastructure bill, we'll see some downside for cyclical sectors, see inflation decelerate a bit, and give some life to growth stocks, even if for a short period.
The US Treasury 30y and 10y yields declined for the week while the 2y yield rose. That tightened the spread between long and short-term yields.
Both the High Yield Corporate Bond (HYG) prices declined while Investment Grade Bond (LQD) prices advanced.
The US Dollar (DXY) continues choppy trading with gains and losses this week. It ended the week at a -0.31% decline.
Silver (SILVER) advanced +0.45% while Gold (GOLD) advanced +2.07%.
Crude Oil (CRUDEOIL1!) declined -2.65%.
The material commodities continued to pull back from record highs two weeks ago.
Timber (WOOD) declined -2.62%.
Copper (COPPER1!) declined -4.30%.
Aluminum (ALI1!) declined -3.52%.
-=x=-=x=-=x=-=x=-=x=-=x=-=x=-
Big Four Mega-caps
Only Alphabet (GOOGL) is trading above its 10w moving average of the big four mega-caps, gaining +0.69% this week. Apple (AAPL) declined -0.61%. Microsoft (MSFT) declined -1.20%. Amazon (AMZN) declined -0.61%. Note that the Nasdaq gained while the largest mega-caps in the index declined. The means the Nasdaq gains came from a broader set of stocks, a positive sign. However, having the big four mega-caps participate in gains would give a boost to investor sentiment.
-=x=-=x=-=x=-=x=-=x=-=x=-=x=-
The Four Recovery Stocks
I picked four recovery stocks to track against the indexes and other indicators in this weekly report. This week, all four recovery stocks declined. Do investors see the recovery as stalling, or do they see the recovery already priced into these stocks? Exxon Mobil (XOM) declined -3.04%. Marriott (MAR) dropped -2.99%. Delta Airlines (DAL) lost -2.38%. Carnival Cruise Lines declined -0.11%.
-=x=-=x=-=x=-=x=-=x=-=x=-=x=-
Cryptocurrency
I'll start tracking four major cryptocurrencies on the week in review. The four are Bitcoin, Ethereum, Litecoin, and Bitcoin Cash. The latter two are not the largest by market cap but seem to be well-known and are part of the CIX capital.com index, tracking five cryptocurrencies, including these four (Ripple is the fifth).
The major cryptocurrencies are in a two-week slide. Bitcoin (BTCUSD) declined -20.48% this week. Ethereum (ETHUSD) is down -37.81%. Litecoin (LTCUSD) dropped -42.89%. Bitcoin Cash (BTHUSD) is down -45.85%. The first two are down nearly 50% from highs. The latter two are down more than 60% from highs.
-=x=-=x=-=x=-=x=-=x=-=x=-=x=-
Investor Sentiment
The put/call ratio (PCCE) remained high, ending the week at 0.668. A contrarian indicator, when the put/call ratio is below 0.7, it signals overly bullish sentiment and could mean an overbought market.
The CNN Fear & Greed Index remains on the fear side.
The NAAIM money manager exposure index declined to 44.21.
-=x=-=x=-=x=-=x=-=x=-=x=-=x=-
The Week Ahead
Monday
There is not much economic news scheduled for Monday. Fed member Brainard will speak in the morning, and Bostic will speak at noon.
Lordstown Motors (RIDE) will report earnings on Monday.
Tuesday
Consumer Confidence and New Home Sales numbers will be released after the market opens on Tuesday.
Intuit (INTU), AutoZone (AZO), Zscaler (ZS), Nordstrom (JWN), MakeMyTrip (MMYT), and UP Fintech (TIGR) will release earnings updates.
Wednesday
Crude Oil Inventories will be released on Wednesday after the market opens.
Earnings releases will include Nvidia (NVDA), Pinduoduo (PDD), Snowflake (SNOW), Workday (WDAY), and Okta (OKTA).
Thursday
On Thursday, Durable Goods orders data will get an update. We will also get the revised GDP numbers for Q1, which should align with the previously released numbers. Initial Jobless Claims and Pending Home Sales will also get an update.
Salesforce.com (CRM), Medtronic (MDT), Costco (COST), VMWare (VMW), Autodesk (ADSK), Dollar General (DG), Veeva Systems (VEEV), HP Inc (HPQ), Best Buy (BBY), Dollar Tree (DLTR), Burlington Stores (BURL), GameStop (GME), and Gap (GPS) release earnings on Thursday.
Friday
Friday will bring another update on inflation with the PCE Price Index data. In addition, we will see updates for Goods Trade Balance, Personal Spending, Retail Inventories, and Consumer Sentiment.
Big Lots (BIG) and Ehang Holdings (EH) will release earnings.
-=x=-=x=-=x=-=x=-=x=-=x=-=x=-
The Bullish Side
It looks like a sentiment change toward growth stocks occurred this past Wednesday when concerns about inflation did not come with any strong hints of monetary policy changes from the Fed. The Fed has pointed to several employment indicators suggesting that easy monetary policy will need to continue for some time until the economy fully recovers.
It also seems inflation may be transitionary as the fed promised. Consumer confidence, retail numbers, and the retail earnings reports this week all point to a possible pullback from high inflation in the second half of the year.
With the low prices for growth stocks, compared to 52-week highs, an all-clear signal could come with quite a rally as Investors rotate from value into growth.
-=x=-=x=-=x=-=x=-=x=-=x=-=x=-
The Bearish Side
Despite the gains this week, volume was lower, suggesting that big institutions are not yet accumulating. That means the brief rally for growth stocks could be short-lived. The big mega-caps did not benefit from the rally, and several met resistance at their 10w moving average lines and remained below the critical level.
Wednesday may have been met with relief by investors, but sensitivity to inflation and any reaction from the Fed remains.
If the infrastructure bill finds support with republicans, we can also expect rotation back into cyclical sectors that will benefit from the extra spending. The demand for commodities will drive prices higher and potentially cause more inflation.
-=x=-=x=-=x=-=x=-=x=-=x=-=x=-
Key Nasdaq Levels to Watch
The Nasdaq closed the week below the critical 21d EMA and 50d MA lines. The index climbed to 13,600 this week before hitting resistance and closing lower on Friday. Note the similarity to late February and early March when the index found support at 13,000, then resistance at 13,600 and dipped lower than 13,000 in the next several days. That's what I'll be watching for this week, hoping we head back to 14,000 instead.
On the positive side, the levels are:
On the downside, there are a few key levels:
-=x=-=x=-=x=-=x=-=x=-=x=-=x=-
Wrap-up
I am still waiting for the Nasdaq to show some solid support from institutional investors. It's going to require broad gains, including mega-caps, mid-caps, and small-caps, on higher volume to get the index moving in an uptrend. That kind of support is necessary to carry many of the influential stocks past resistance areas.
There is a good possibility that the index will move lower before a new uptrend occurs. That's not necessarily a bad thing if the index moves lower first, and we can end the months of sideways chop that tests a growth investor's endurance. Then after finding a solid bottom, the index and big tech and growth can have at least a few weeks of solid gains.
Watch out for progress on the infrastructure bill and any more hints at inflation worries as potential catalysts to the downside.
Good luck, stay healthy, and trade safe!
Notes
- The Market Week in Review is my weekend homework where I look over what happened in the previous week and what might come in the next week.
- I occasionally have some errors or typos and will correct them in my blog or the comments on TradingView. I do not have an editor and do this in my free time.
- If you find this helpful, please let me know in the comments. I am also more than happy to add new perspectives and data points if you have ideas.
The structure is the following:
- A recap of the daily updates that I do here on TradingView.
- The Meaning of Life, a view on the past week
- What's coming in the next week
- The Bullish View, The Bearish View
- Key index levels to watch out for
- Wrap-up
If you have been following my daily updates, you can skip down to "The Meaning of Life." If not, then this first part is a great play-by-play recap for the week. Click the daily charts for more detail on sectors, indexes, and market leaders each day.
-=x=-=x=-=x=-=x=-=x=-=x=-=x=-
Monday, May 17, 2021

Facts: -0.38%, Volume lower, Closing range: 85%, Body: 8%
Good: Close in upper part of range, bulls took over in afternoon
Bad: Lower high, selling most of day
Highs/Lows: Lower high, higher low
Candle: Tiny thin body over a long lower wick.
Advanced/Decline: More declining stocks than advancing stocks
Indexes: SPX (-0.25%), DJI (-0.16%), RUT (+0.11%), VIX (+4.84%)
Sectors: Energy (XLE +2.32%) and Materials (XLB +0.88%) were top. Communications (XLC -0.79%) and Utilities (XLU -0.82%) were bottom.
Expectation: Sideways or Higher
Monday started with a dip, just like the past several Mondays. This week's difference is that the bulls entered in the afternoon, bringing the major indices back to near their open. Small Caps performed best on the day as inflation still weighed on big tech and mid-cap growth.
The Nasdaq closed with a -0.38% loss on lower volume. The 85% closing range over an 8% green body is in the upper part of the candle over a long lower wick. The candle indicates the bulls weren't willing to let go, but still, there was indecision in the market. There were more declining stocks than advancing stocks.
-=x=-=x=-=x=-=x=-=x=-=x=-=x=-
Tuesday, May 18, 2021

Facts: -0.56%, Volume higher, Closing range: 2%, Body: 61%
Good: Higher high, higher low
Bad: Couldn't hold morning rally, closed day at low
Highs/Lows: Higher high, higher low
Candle: Red body under a long upper wick and almost no lower wick
Advanced/Decline: More declining stocks than advancing stocks
Indexes: SPX (-0.85%), DJI (-0.78%), RUT (-0.73%), VIX (+8.22%)
Sectors: Real Estate (XLRE +0.19%) and Health (XLV +0.03%) were top. Industrials (XLI -1.46%) and Energy (XLE -2.32%) were bottom.
Expectation: Sideways or Lower
Surprisingly robust earnings reports from big retail before market open sent major indices on a rally in the morning. Still, the bullish exuberance couldn't hold on, and the indices closed the day with losses. Despite the downward pressure on the indexes, the growth stock list had a relatively good day.
The Nasdaq closed with a -0.56% loss for the day but was able to turn in a higher high and higher low than the previous day. The index rose in the early morning but then fell the rest of the day, creating an upper wick in the morning but ending the day with a 2% closing range underneath a 61% red body. Volume was higher for the day, with intraday volume more elevated in the morning than in the afternoon. There were more declining stocks than advancing stocks.
-=x=-=x=-=x=-=x=-=x=-=x=-=x=-
Wednesday, May 19, 2021
Facts: -0.03%, Volume higher, Closing range: 2%, Body: 61%
Good: Thick green body shows buying after a gap down at open
Bad: Gap down at open
Highs/Lows: Lower high, lower low
Candle: All green body, barely visible upper and lower wicks
Advanced/Decline: Two declining stocks for every advancing stock
Indexes: SPX (-0.29%), DJI (-0.48%), RUT (-0.78%), VIX (+3.94%)
Sectors: Technology (XLK +0.35%) and Communications (XLC +0.16%) were top. Materials (XLB -1.53%) and Energy (XLE -2.49%)
Expectation: Sideways or Higher
You shake my nerves, and you rattle my brain! There is no question what investors worried about today. They took risk off the table at open ahead of the Fed minutes. Then morning comments from Fed member Quarles started to attract investors back in but at lowering volume. When the meeting minutes were released, volume popped back up as the market reacted.
The Nasdaq closed with a -0.03% loss, much better than the -1.71% dip at open. Volume was higher than the previous day. The 95% green body and 98% closing range shows the buying throughout the day. There is the potential, as with 5/11, that the gap down caused some shorts to cover and take profits. But much of the action seemed to be centered around the 2 pm release of the Fed minutes. There were two declining stocks for every advancing stock.
-=x=-=x=-=x=-=x=-=x=-=x=-=x=-
Thursday, May 20, 2021

Facts: +1.77%, Volume lower, Closing range: 89% (w/gap), Body: 86%
Good: No lower wick, thick green body with high closing range
Bad: Lower volume
Highs/Lows: Higher high, higher low
Candle: Gap up at open, mostly green body with a short upper wick
Advanced/Decline: Three advancing stocks for every two declining stocks
Indexes: SPX (+1.06%), DJI (+0.55%), RUT (+0.64%), VIX (-6.81%)
Sectors: Technology (XLK +1.91%) and Communications (XLC +1.71%) were top. Financials (XLF +0.05%) and Energy (XLE -0.15%) were bottom.
Expectation: Higher
A better-than-expected jobs report was enough to continue the trend in Technology and Communications stocks that started yesterday. Eyes remain on the Fed and inflation. Still, a drop in the US dollar and US treasury rates, in addition to lowering expectations from a few retailers, gave investors some relief that the economy was not overheating out of control.
The Nasdaq closed the day with a +1.77% advance. Volume was lower, but the gap-up and higher high and higher low are both great signs. With the gap, the closing range was 89%. An 86% green body sits under a short upper wick formed late in the date. There is no visible lower wick. There were three advancing stocks for every two declining stocks.
-=x=-=x=-=x=-=x=-=x=-=x=-=x=-
Friday, May 21, 2021

Facts: -0.48%, Volume lower, Closing range: 5%, Body: 95%
Good: Higher high, higher low, lower volume on down day
Bad: Selling throughout session, high at open, low near close
Highs/Lows: Higher high, higher low
Candle: Barely visible lower wick, no upper wick, mostly red body
Advanced/Decline: Slightly more declining than advancing stocks
Indexes: SPX (-0.08%), DJI (+0.36%), RUT (+0.34%), VIX (-2.52%)
Sectors: Financials (XLF +0.99%) and Utilities (XLU +0.52%) were top. Consumer Discretionary (XLY -0.50%) and Technology (XLK -0.55%) were bottom.
Expectation: Sideways
Big tech and growth stocks paused after two days of gains, while investors boosted recovery stocks after good economic data in the morning. The purchasing manager indexes for Manufacturing and Services were higher than expected, indicating an uptick in demand in both sectors.
The Nasdaq started the day in the positive but ended with a -0.48% decline after a full day of selling. Volume was lower than the previous day. The Nasdaq did put in a higher high and higher low than Thursday. However, the candle is an almost entirely red body, with a 5% closing range. There were slightly more declining stocks than advancing stocks.
-=x=-=x=-=x=-=x=-=x=-=x=-=x=-
The Meaning of Life (View on the Week)
Are you tired of hearing about inflation yet? Well, it's still very much the focus of investors and driving the wild up-and-down movements in the Nasdaq. This week's most crucial moment was clearly on Wednesday at 2:00 pm when the Fed released the minutes from last month's meeting. Investors poured over the report looking between the lines for hints of inflation concerns and potential fed action to control it.
On Monday and Tuesday, the Nasdaq retreated ahead of the Fed minutes release. Investors focused on cyclical sectors (XLE, XLB) on Monday and defensive sector sectors (XLRE, XLV, XLU) on Tuesday. The market opened with a gap down on Wednesday. Investors responded to the gap and slowly bought back stocks through the morning as volume dropped on the Nasdaq.
At the 2:00 pm release of the fed minutes, volume immediately picked back up, and a rally began that lasted through Thursday. The rally also came with a change in the sector list. The growth sectors of Technology (XLK) and Communications (XLC) led from Wednesday morning through Thursday.
On Friday, the growth sectors paused while some of the value plays had a chance to catch up. I'll include the Growth/Value chart that frequently shows up in the weekly review. In the chart, you can see the spike in growth relative to value on Wednesday and Thursday, with a slight retreat on Friday.
There is not enough for a trend yet. And there is still question of which way the market will go in the next few weeks. The first question is in this chart. Is this spike in growth vs. value an indication of a trend? Have popular growth stocks found a bottom and ready to climb again? Or is it merely a quick spike, and investors will move back to the value trade?
The Nasdaq advanced +0.31% on the lowest volume week thus far in 2021. The closing range of 73% is a good sign, while the inside week and thin green body show indecision in direction.
The other three major indices all declined for the week. The S&P 500 (SPX) lost -0.43%. The Dow Jones Industrial Average (DJI) declined -0.51%. The Russell 2000 (RUT) fell -0.42%.
The VIX volatility index closed the week with a +6.59% weekly gain.

Sector performance provides some clues this week on how investors are thinking about inflation and the Fed. Like the market character changed around the Wednesday release of the Fed meeting minutes, the sectors also saw a change in leadership. The question remains if that new character sticks for the coming weeks or gets disrupted as the inflation story unfolds.
Real Estate ( XLRE ), Health Care ( XLV ), and Utilities ( XLU ) top the list for the full week, and that reflects well the overall mood of investors. These sectors are used as defensive sectors. Regardless of whether economic conditions serve better cyclical stocks or growth stocks, the services in these defensive sectors are always required. Consumer Staples ( XLP ) is also up in that list and outperformed the S&P 500 index.
For the remaining sectors, it's worth looking at performance before and after the Wednesday Fed release. Coming into the week, there was a clear focus on cyclical sectors, with Energy ( XLE ) and Materials ( XLB ) leading on Monday. Investors turned defensive on Tuesday, popping the defensive sectors to the top. And then the gap down at open came on Wednesday with shifting investments on lower volume leading into the meeting minutes release at 2p.
After Wednesday, it's clear there was a change in sentiment. Technology ( XLK ) and Communications ( XLC ) came out of the gap-down and performed best through the end of the week, despite a small pullback for both on Friday. They performed well enough to end the week outperforming the S&P 500 index.
That leaves the cyclical sectors at the bottom of the list. Materials ( XLB ), Industrials ( XLI ), and Energy ( XLE ) were the bottom three sectors. For these sectors, much rests on Biden's infrastructure plans passing through congress, but the proposals continue to be rejected by Republicans. It's reasonable to expect that with continued headwinds for the infrastructure bill, we'll see some downside for cyclical sectors, see inflation decelerate a bit, and give some life to growth stocks, even if for a short period.
The US Treasury 30y and 10y yields declined for the week while the 2y yield rose. That tightened the spread between long and short-term yields.
Both the High Yield Corporate Bond (HYG) prices declined while Investment Grade Bond (LQD) prices advanced.
The US Dollar (DXY) continues choppy trading with gains and losses this week. It ended the week at a -0.31% decline.
Silver (SILVER) advanced +0.45% while Gold (GOLD) advanced +2.07%.
Crude Oil (CRUDEOIL1!) declined -2.65%.
The material commodities continued to pull back from record highs two weeks ago.
Timber (WOOD) declined -2.62%.
Copper (COPPER1!) declined -4.30%.
Aluminum (ALI1!) declined -3.52%.
-=x=-=x=-=x=-=x=-=x=-=x=-=x=-
Big Four Mega-caps
Only Alphabet (GOOGL) is trading above its 10w moving average of the big four mega-caps, gaining +0.69% this week. Apple (AAPL) declined -0.61%. Microsoft (MSFT) declined -1.20%. Amazon (AMZN) declined -0.61%. Note that the Nasdaq gained while the largest mega-caps in the index declined. The means the Nasdaq gains came from a broader set of stocks, a positive sign. However, having the big four mega-caps participate in gains would give a boost to investor sentiment.
-=x=-=x=-=x=-=x=-=x=-=x=-=x=-
The Four Recovery Stocks
I picked four recovery stocks to track against the indexes and other indicators in this weekly report. This week, all four recovery stocks declined. Do investors see the recovery as stalling, or do they see the recovery already priced into these stocks? Exxon Mobil (XOM) declined -3.04%. Marriott (MAR) dropped -2.99%. Delta Airlines (DAL) lost -2.38%. Carnival Cruise Lines declined -0.11%.
-=x=-=x=-=x=-=x=-=x=-=x=-=x=-
Cryptocurrency
I'll start tracking four major cryptocurrencies on the week in review. The four are Bitcoin, Ethereum, Litecoin, and Bitcoin Cash. The latter two are not the largest by market cap but seem to be well-known and are part of the CIX capital.com index, tracking five cryptocurrencies, including these four (Ripple is the fifth).
The major cryptocurrencies are in a two-week slide. Bitcoin (BTCUSD) declined -20.48% this week. Ethereum (ETHUSD) is down -37.81%. Litecoin (LTCUSD) dropped -42.89%. Bitcoin Cash (BTHUSD) is down -45.85%. The first two are down nearly 50% from highs. The latter two are down more than 60% from highs.
-=x=-=x=-=x=-=x=-=x=-=x=-=x=-
Investor Sentiment
The put/call ratio (PCCE) remained high, ending the week at 0.668. A contrarian indicator, when the put/call ratio is below 0.7, it signals overly bullish sentiment and could mean an overbought market.
The CNN Fear & Greed Index remains on the fear side.
The NAAIM money manager exposure index declined to 44.21.
-=x=-=x=-=x=-=x=-=x=-=x=-=x=-
The Week Ahead
Monday
There is not much economic news scheduled for Monday. Fed member Brainard will speak in the morning, and Bostic will speak at noon.
Lordstown Motors (RIDE) will report earnings on Monday.
Tuesday
Consumer Confidence and New Home Sales numbers will be released after the market opens on Tuesday.
Intuit (INTU), AutoZone (AZO), Zscaler (ZS), Nordstrom (JWN), MakeMyTrip (MMYT), and UP Fintech (TIGR) will release earnings updates.
Wednesday
Crude Oil Inventories will be released on Wednesday after the market opens.
Earnings releases will include Nvidia (NVDA), Pinduoduo (PDD), Snowflake (SNOW), Workday (WDAY), and Okta (OKTA).
Thursday
On Thursday, Durable Goods orders data will get an update. We will also get the revised GDP numbers for Q1, which should align with the previously released numbers. Initial Jobless Claims and Pending Home Sales will also get an update.
Salesforce.com (CRM), Medtronic (MDT), Costco (COST), VMWare (VMW), Autodesk (ADSK), Dollar General (DG), Veeva Systems (VEEV), HP Inc (HPQ), Best Buy (BBY), Dollar Tree (DLTR), Burlington Stores (BURL), GameStop (GME), and Gap (GPS) release earnings on Thursday.
Friday
Friday will bring another update on inflation with the PCE Price Index data. In addition, we will see updates for Goods Trade Balance, Personal Spending, Retail Inventories, and Consumer Sentiment.
Big Lots (BIG) and Ehang Holdings (EH) will release earnings.
-=x=-=x=-=x=-=x=-=x=-=x=-=x=-
The Bullish Side
It looks like a sentiment change toward growth stocks occurred this past Wednesday when concerns about inflation did not come with any strong hints of monetary policy changes from the Fed. The Fed has pointed to several employment indicators suggesting that easy monetary policy will need to continue for some time until the economy fully recovers.
It also seems inflation may be transitionary as the fed promised. Consumer confidence, retail numbers, and the retail earnings reports this week all point to a possible pullback from high inflation in the second half of the year.
With the low prices for growth stocks, compared to 52-week highs, an all-clear signal could come with quite a rally as Investors rotate from value into growth.
-=x=-=x=-=x=-=x=-=x=-=x=-=x=-
The Bearish Side
Despite the gains this week, volume was lower, suggesting that big institutions are not yet accumulating. That means the brief rally for growth stocks could be short-lived. The big mega-caps did not benefit from the rally, and several met resistance at their 10w moving average lines and remained below the critical level.
Wednesday may have been met with relief by investors, but sensitivity to inflation and any reaction from the Fed remains.
If the infrastructure bill finds support with republicans, we can also expect rotation back into cyclical sectors that will benefit from the extra spending. The demand for commodities will drive prices higher and potentially cause more inflation.
-=x=-=x=-=x=-=x=-=x=-=x=-=x=-
Key Nasdaq Levels to Watch
The Nasdaq closed the week below the critical 21d EMA and 50d MA lines. The index climbed to 13,600 this week before hitting resistance and closing lower on Friday. Note the similarity to late February and early March when the index found support at 13,000, then resistance at 13,600 and dipped lower than 13,000 in the next several days. That's what I'll be watching for this week, hoping we head back to 14,000 instead.
On the positive side, the levels are:
- The 21d EMA is at 13,525.47.
- The 50d MA is at 13,578.31.
- There is a resistance area between 13,600 and 13,700.
- The high of this past week was 13,616.58.
- The rally attempt of the previous week went to 13,828.62. Get above this level to end the sequence of lower highs.
- 14,000 has been a key area of support/resistance. The index has only stayed above this level for a few days at a time since the beginning of 2021.
- The all-time high is at 14,211.57 is the all-time high.
On the downside, there are a few key levels:
- The 10d MA is at 13,336.71.
- The low of this past week is 13,072.23.
- That low is just above the 13,000 support line.
- 12,786.81 is a low pivot point from the late March dip. Stay above this low to keep an upward trend since early March.
- 12,543.86 is the 200d MA. This could be a support point if the index falls below 13,000.
- 12,397.05 is a low pivot point from the early March dip.
-=x=-=x=-=x=-=x=-=x=-=x=-=x=-
Wrap-up
I am still waiting for the Nasdaq to show some solid support from institutional investors. It's going to require broad gains, including mega-caps, mid-caps, and small-caps, on higher volume to get the index moving in an uptrend. That kind of support is necessary to carry many of the influential stocks past resistance areas.
There is a good possibility that the index will move lower before a new uptrend occurs. That's not necessarily a bad thing if the index moves lower first, and we can end the months of sideways chop that tests a growth investor's endurance. Then after finding a solid bottom, the index and big tech and growth can have at least a few weeks of solid gains.
Watch out for progress on the infrastructure bill and any more hints at inflation worries as potential catalysts to the downside.
Good luck, stay healthy, and trade safe!
Comment:
Clarification: “ Watch out for progress on the infrastructure bill and any more hints at inflation worries as potential catalysts to the downside for big tech, growth stocks and the Nasdaq.”