Summary: Fears of a slowing economic recovery among rising cases of the Delta variant drove investors through a volatile week in the stock market. To make things worse, the Fed meeting minutes indicated that tapering could begin within this year. Despite the bad news, investors stuck with equities but rotated into defensive sectors.
Notes
The structure is the following:
If you have been following my daily updates, you can skip down to "View on the Week." If not, then this first part is a great play-by-play recap for the week. Click the daily charts for more detail on sectors, indexes, and market leaders each day.
-=x=-=x=-=x=-=x=-=x=-=x=-=x=-
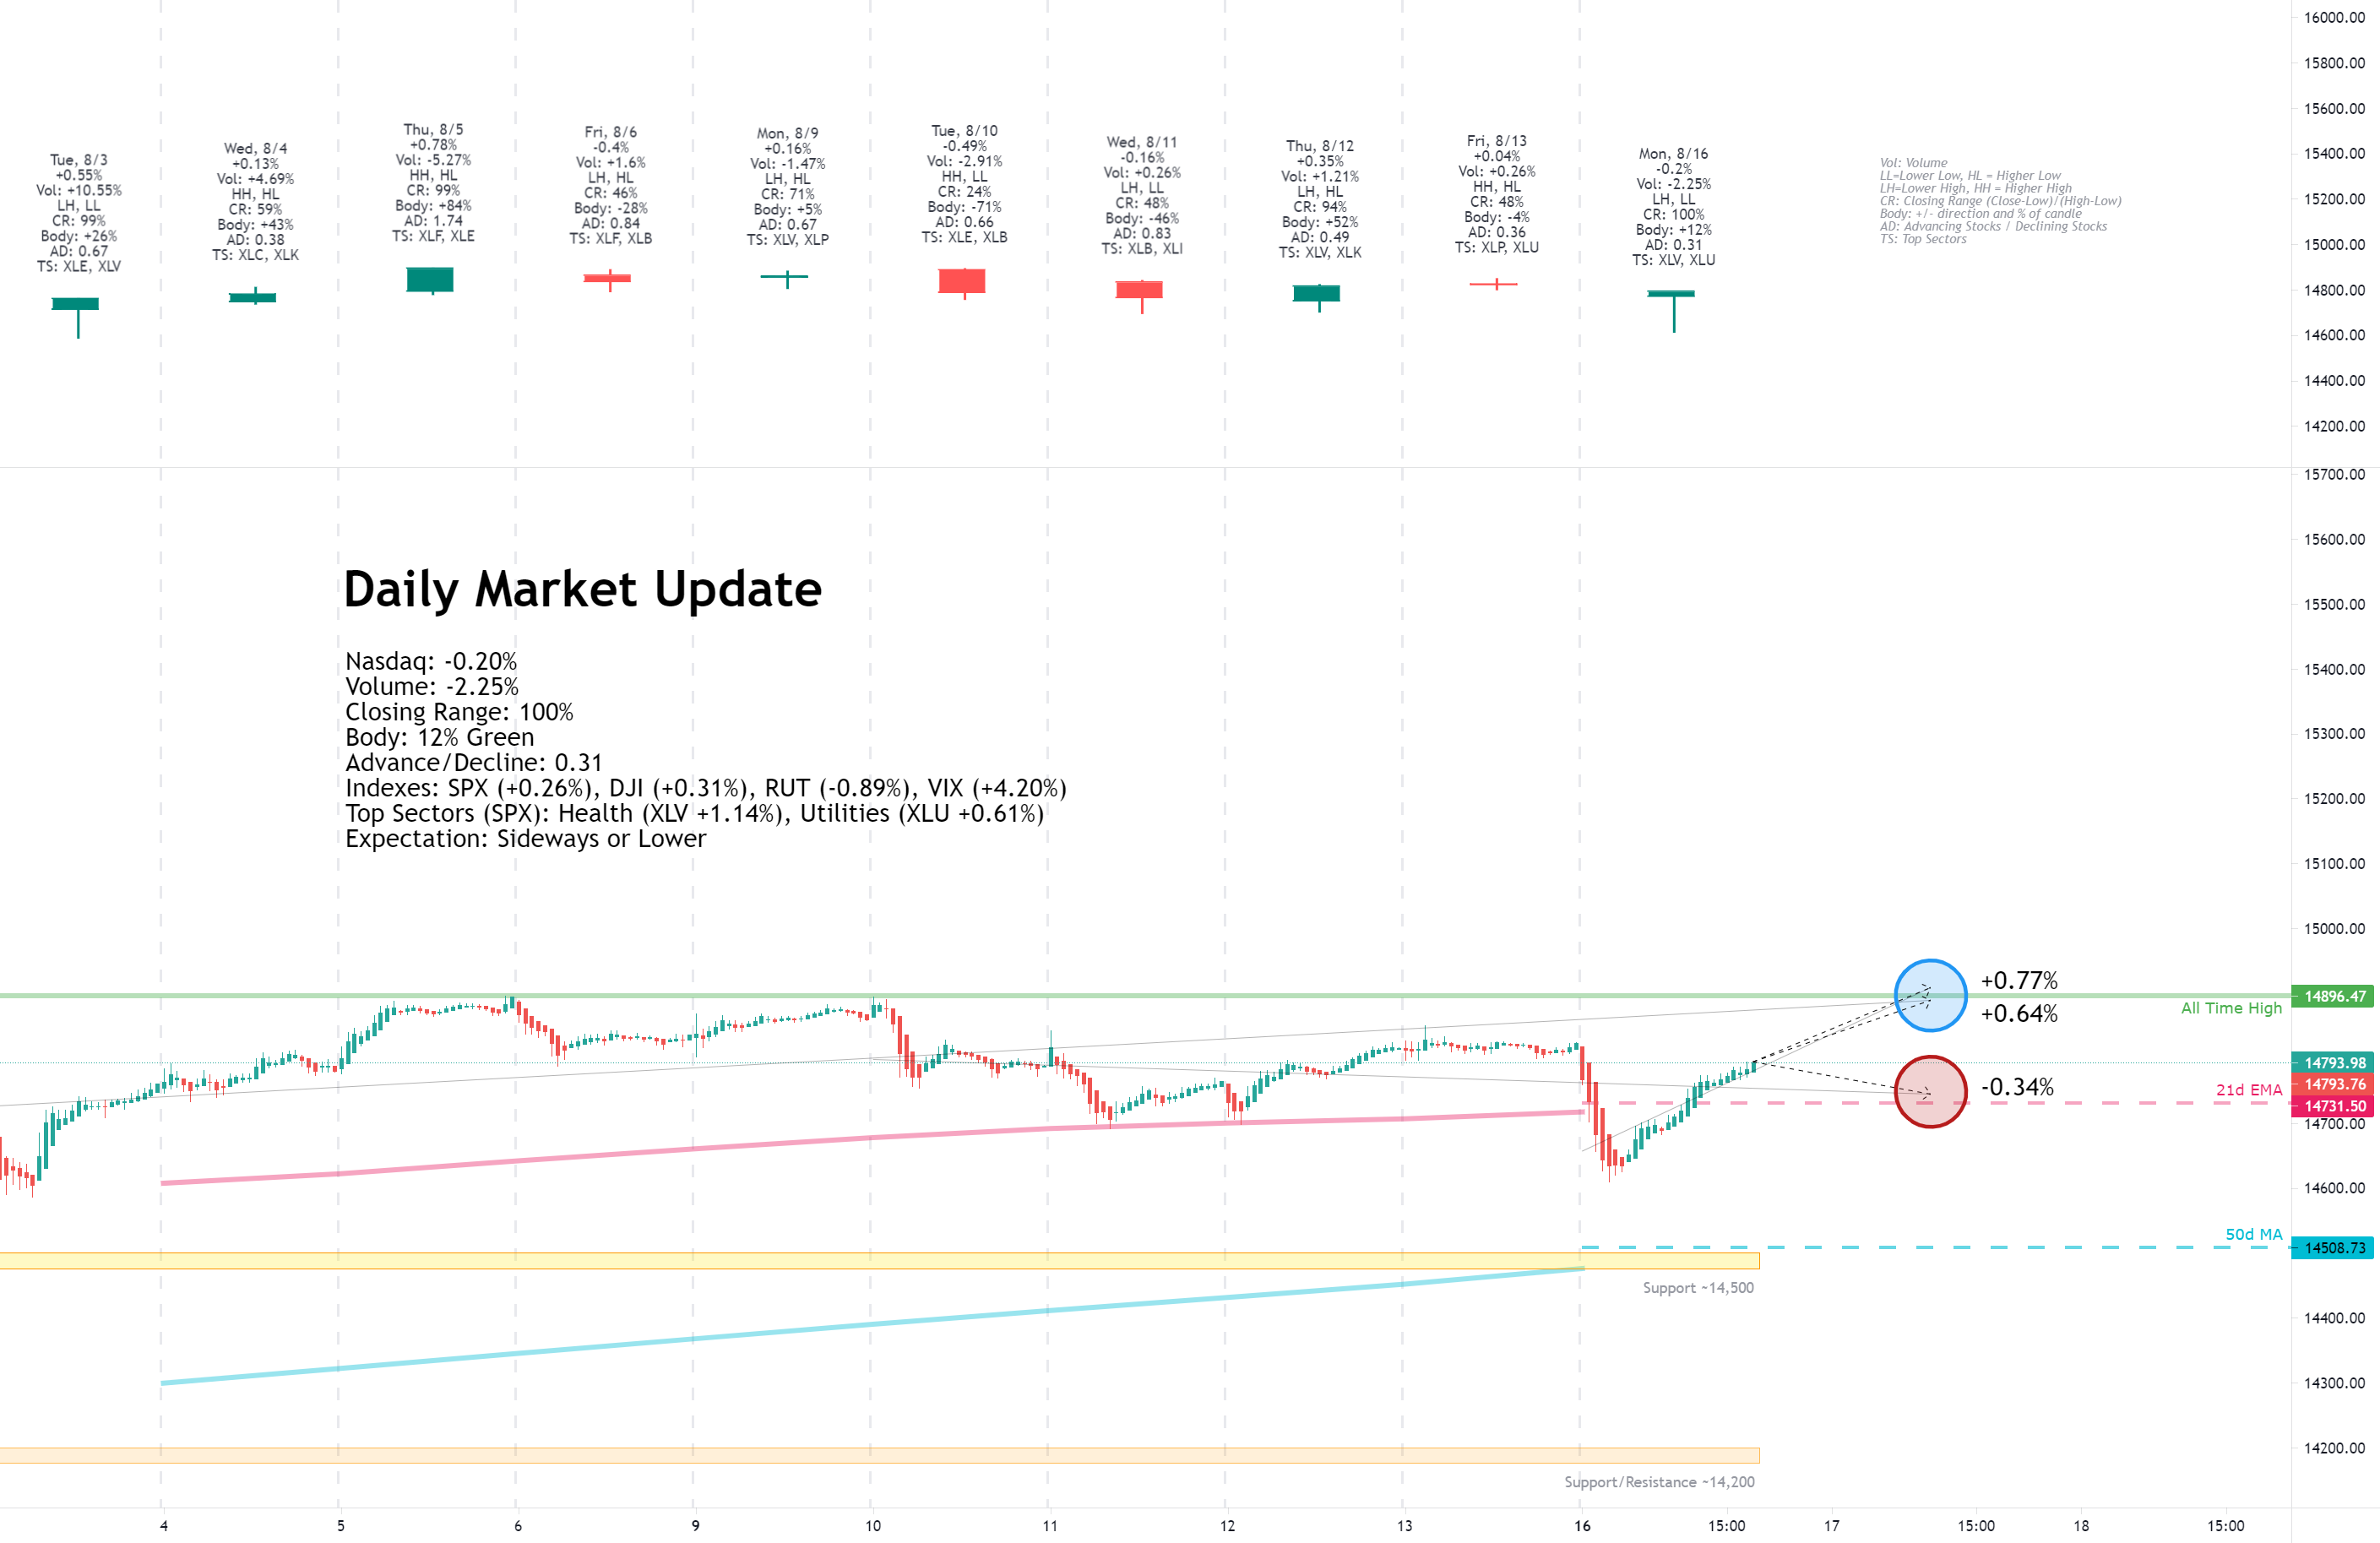
Monday, August 16, 2021

Facts: -0.20%, Volume lower, Closing range: 100%, Body: 12%
Good: Volume lower on retreat, high closing range
Bad: Long lower wick pierced through 21d EMA
Highs/Lows: Lower high, lower low
Candle: Hanging man, small body above long lower wick within uptrend
Advanced/Decline: 0.31, more than three declining stocks for every advancing stock
Indexes: SPX (+0.26%), DJI (+0.31%), RUT (-0.89%), VIX (+4.20%)
Sectors: Health (XLV +1.14%) and Utilities (XLU +0.61%)
at the top. Materials (XLB -0.50%) and Energy (XLE -1.84%) at the bottom.
Expectation: Sideways or Lower
Investors sold off equities in the morning and then seemingly decided there was nowhere else to put the money and bought back assets in the afternoon. Money moved back into the market, mostly into defensive sectors, sending the S&P 500 and Dow Jones Industrial (DJI) to another set of records.
The Nasdaq closed with a decline of -0.20% after dipping more than 1.4% in the morning. Volume was lower than the previous day. The thin body above a long lower wick creates a hanging man candlestick within an uptrend. The closing range of 100% shows bulls kept up the buying into close. Still, there were more than three declining stocks for every advancing stock for the day.
-=x=-=x=-=x=-=x=-=x=-=x=-=x=-
Tuesday, August 17, 2021
Facts: -0.93%, Volume higher, Closing range: 63%, Body: 9%
Good: Stayed above 50d MA
Bad: Break down below 21d EMA on higher volume
Highs/Lows: Lower high, lower low
Candle: Thin red body in upper half of candle, longer lower wick
Advanced/Decline: 0.32, more than three declining stocks for every advancing stock
Indexes: SPX (-0.71%), DJI (-0.79%), RUT (-1.19%), VIX (+11.24%)
Sectors: Health (XLV +1.18%) and Real Estate (XLRE +0.19%) at the top. Materials (XLB -1.15%) and Consumer Discretionary (XLY -2.37%) at the bottom.
Expectation: Lower
Disappointing retail sales data confirmed fears that the rising cases of the Delta variant are slowing down the economic recovery. That sent major indexes lower on Tuesday. Only the defensive sectors ended the day with gains.
The Nasdaq closed with a -0.93% loss on higher volume than the previous day, marking a distribution day for the index. The candle has a thin red body in the upper half of the candle. The closing range is 63%, and the body only covers 9% of the candle. The lower wick is longer than the upper wick. There were more than three declining stocks for every advancing stock on the Nasdaq.
-=x=-=x=-=x=-=x=-=x=-=x=-=x=-
Wednesday, August 18, 2021
Facts: -0.89%, Volume lower, Closing range: 5%, Body: 61%
Good: Lower volume
Bad: Close below the 50d MA, sell-off before close of market
Highs/Lows: Lower high, lower low
Candle: Large red body below short upper wick
Advanced/Decline: 0.38, nearly three declining stocks for every advancing stock
Indexes: SPX (-1.07%), DJI (-1.08%), RUT (-0.84%), VIX (+20.32%)
Sector List: Consumer Discretionary (XLY +0.36%) and Utilities (XLU -0.51%) at the top. Health (XLV -1.52%) and Energy (XLE -2.08%) at the bottom.
Expectation: Lower
Stocks slid after the Fed released meeting minutes from last month, raising fears that tapering support for the economy could come earlier than previously thought. Most sectors declined, with only Consumer Discretionary holding onto a gain for the day.
The Nasdaq closed with a -0.89% loss, dipping just below the 50-day moving average line. Volume was lower than the previous day. The closing range of 5% is below a 61% red body. There is a short upper wick with a very tiny lower wick. There were almost three stocks declining for every advancing stock.
-=x=-=x=-=x=-=x=-=x=-=x=-=x=-
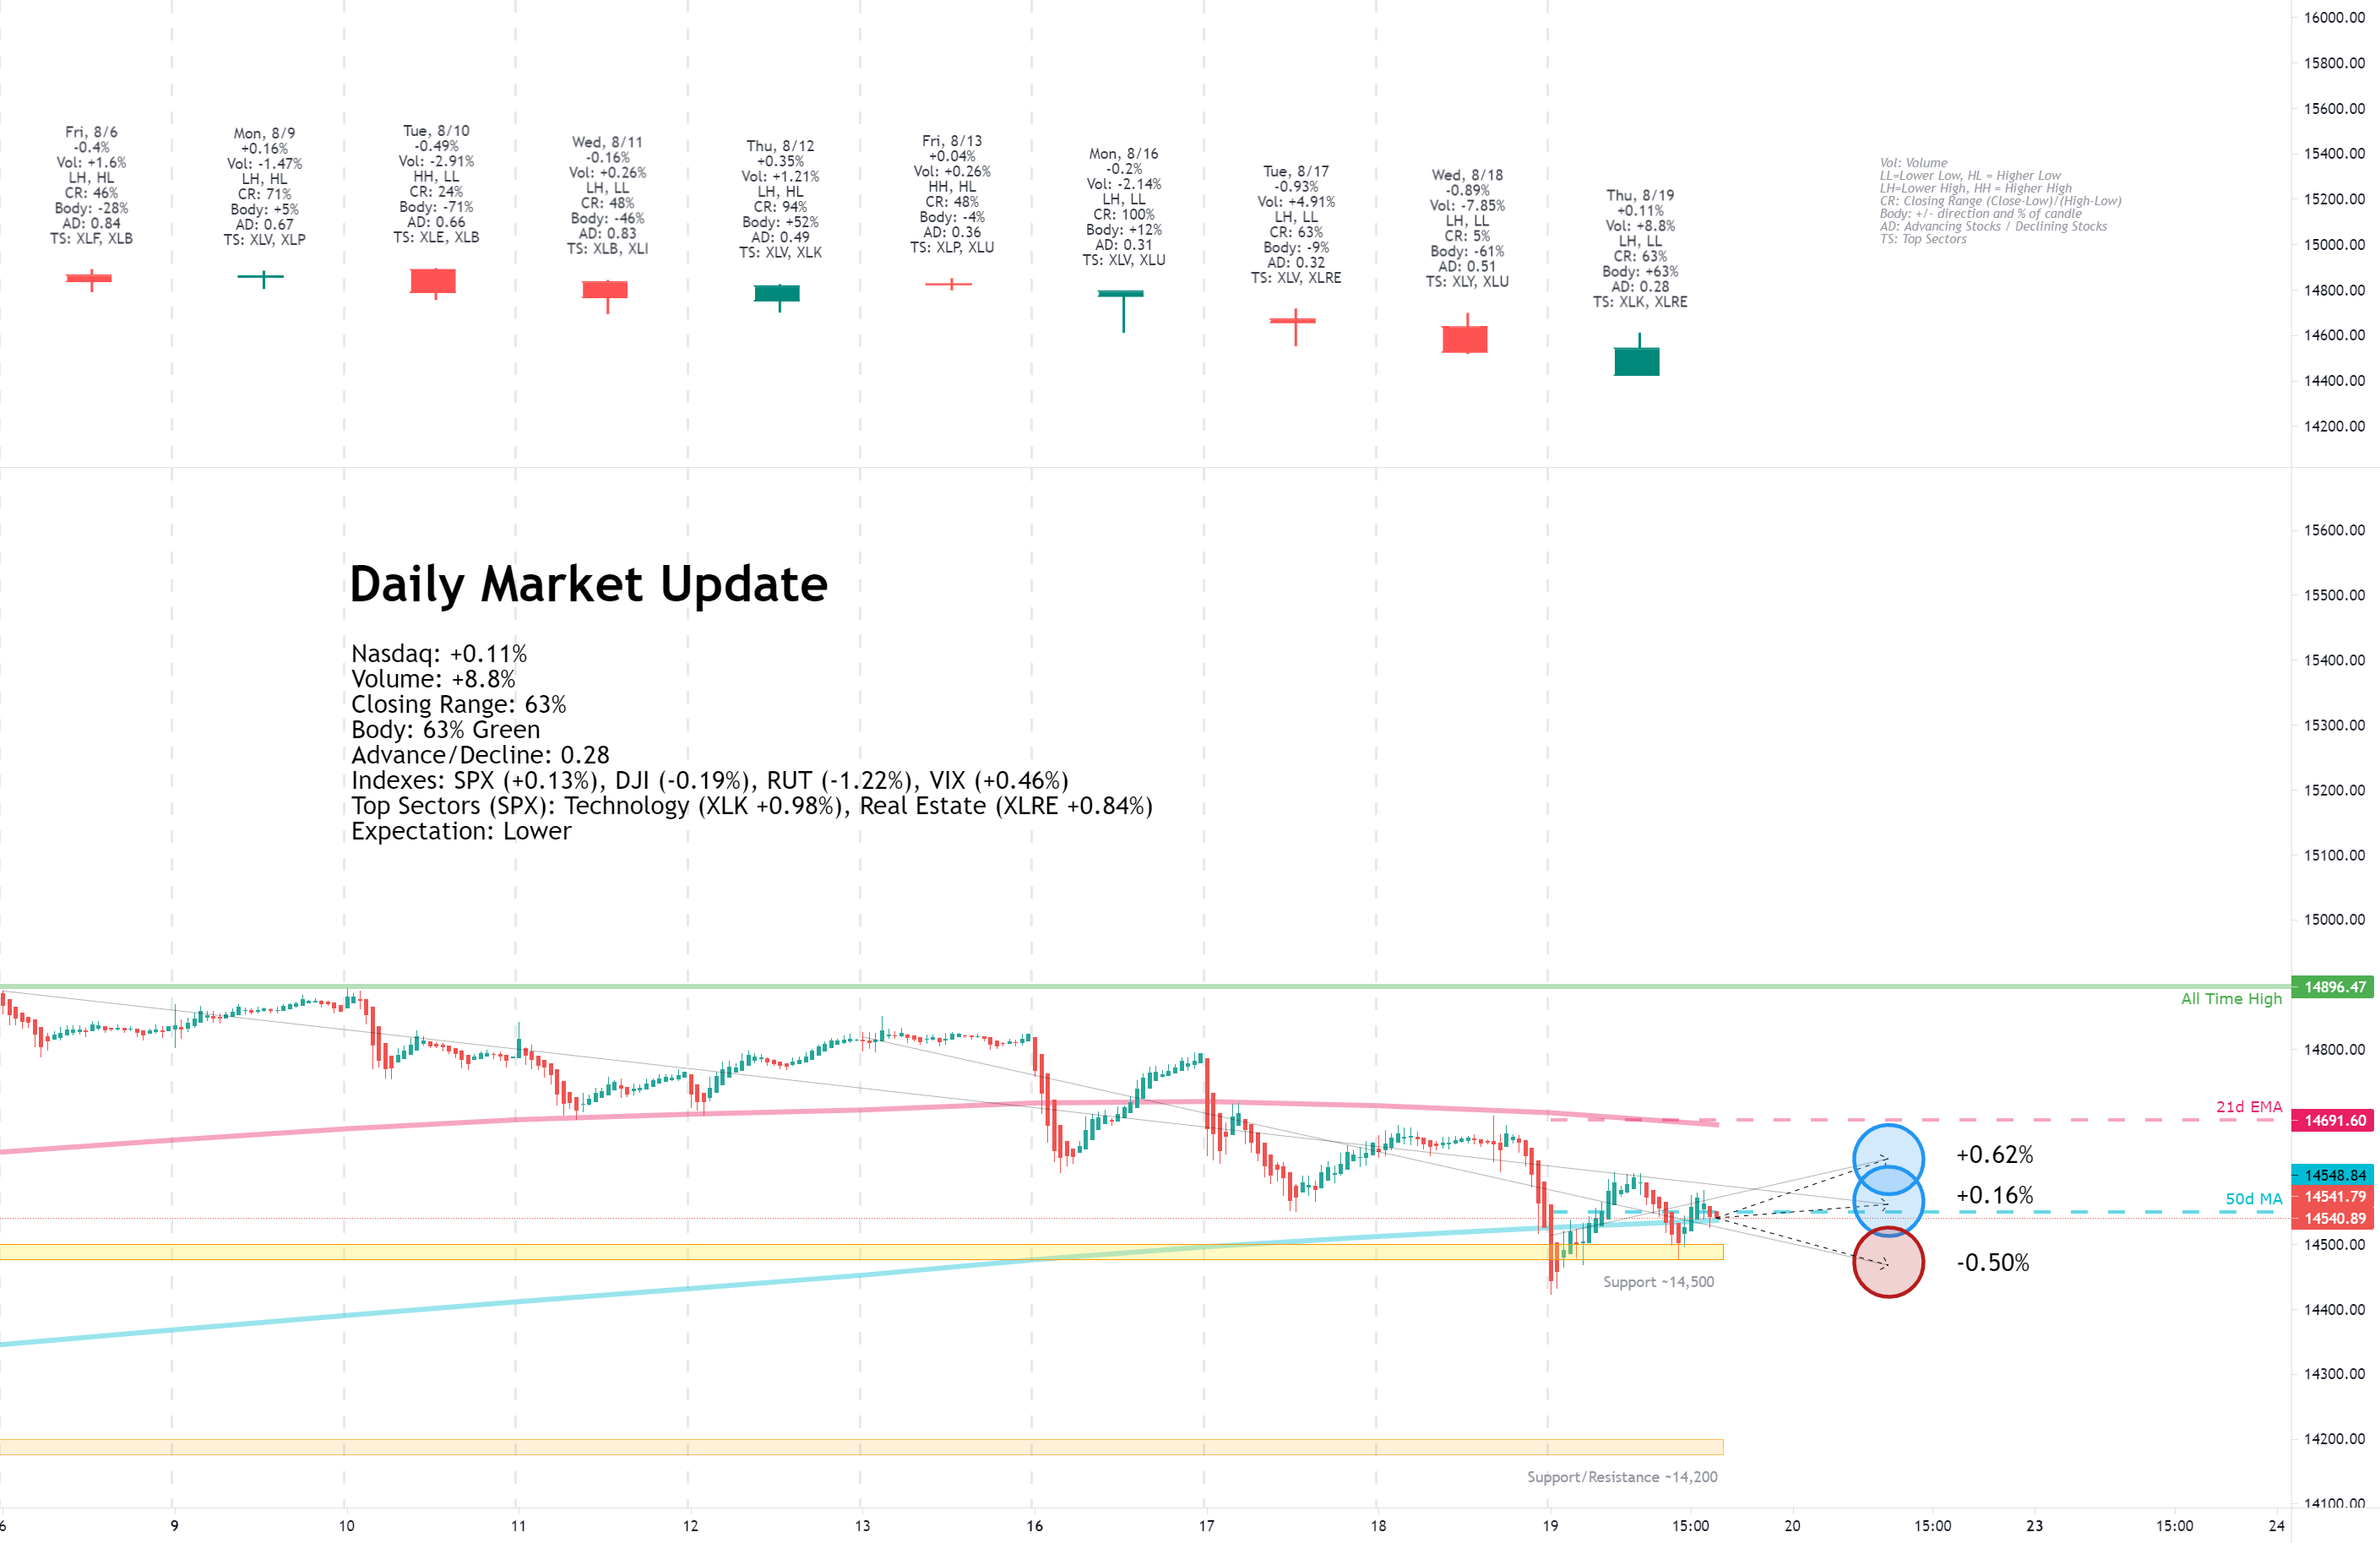
Thursday, August 19, 2021
Facts: +0.11%, Volume higher, Closing range: 63%, Body: 63%
Good: Higher volume on gain, close near the 50d MA
Bad: Lower high, lower low continues downtrend
Highs/Lows: Lower high, lower low
Candle: No lower wick, large green body underneath upper wick
Advanced/Decline: 0.28, over three declining stocks for every advancing stock
Indexes: SPX (+0.13%), DJI (-0.19%), RUT (-1.22%), VIX (+0.46%)
Sector List: Technology (XLK +0.98%) and Real Estate (XLRE +0.84%) at the top. Materials (XLB -0.89%) and Energy (XLE -2.60%) at the bottom.
Expectation: Lower
Investors grappled today with reactions to the Fed meeting minutes released late on Wednesday. The minutes showed several officials in the Fed see the possibility that a key employment goal may be met before year-end and would allow tapering to begin. The result was a dip at open followed by a volatile day as the market priced in the impact.
The Nasdaq cleared a small gain for the day, advancing +0.11% and closing at the 50-day moving average line. Volume was higher than the previous day. The candle has no lower wick, a 63% green body, and a 37% upper wick. The index could not hold onto the gains from the morning rally. Despite the slight increase, there were more than three declining stocks for every advancing stock.
-=x=-=x=-=x=-=x=-=x=-=x=-=x=-
Friday, August 20, 2021
Facts: +1.19%, Volume lower, Closing Range: 95%, Body: 95% Green
Good: All green body, high advance/decline ratio
Bad: Lower volume
Highs/Lows: Higher high, Higher low
Candle: Mostly green body with a tiny upper wick, low above yesterday's close
Advance/Decline: 1.68, three advancing stocks for every two declining stocks
Indexes: SPX (+0.81%), DJIA (+0.65%), RUT (+1.65%), VIX (-14.35%)
Sector List: Technology (XLK +1.29%) and Utilities (XLU +1.25%) at the top. Energy (XLE +0.22%) and Consumer Staples (XLP +0.17%) at the bottom.
Expectation: Higher
The market shrugged off worries about the Fed tapering of economic support to rally higher today. While the indexes were still below recent highs, the day was an excellent structural day, with gains shared broadly across the market.
The Nasdaq closed +1.19% higher. Volume was lower than the previous day. The candle is almost entirely green body, with a short upper wick. The closing range of 95% and 95% body creates the second candle in a row with no lower wick. The index closed back above its 21d EMA as three stocks advanced for every two that declined.
-=x=-=x=-=x=-=x=-=x=-=x=-=x=-
View on the Week
Fears of a slowing economic recovery among rising cases of the Delta variant drove investors through a volatile week in the stock market. To make things worse, the Fed meeting minutes indicated that tapering could begin within this year. Despite the bad news, investors stuck with equities but rotated into defensive sectors.
It opened on Monday with news of China retail sales falling much lower than expected. That sent indexes lower on Monday before prices recovered from the shocking news. Despite the dip, the S&P 500 and Dow Jones Industrial Average had another record close for the day.
The bounce was short-lived. Tuesday brought the US Retail Sales data, which also came in lower than expected. That turned many bulls into bears, and the indexes moved lower and with higher volume. The Nasdaq closed below its 21d exponential moving average line.
It seemed all was clear on Wednesday as buyers came back into the market, but then the Fed released meeting minutes in the afternoon that reversed the dip-buying. The Fed's minutes showed several Fed officials believed that tapering could start this year as key economic recovery goals were being met. The index sold off to close below its 50d moving average line.
The selling resulted in a gap down at open on Thursday, but the sudden drop below 14,500 seemed enough to get investors back into the game, and the opening price became the low of the day. The rally took the Nasdaq back above its 50d moving average but then faded to close below. Given the fade and the lower high and lower low for the day, the expectation was still for the Nasdaq to move lower on Friday.
That did not happen. Instead, the index opened above the 50d moving average and rose the entire day to close above its 21d exponential moving average. There were more advancing stocks than declining stocks, and all sectors gained. That was an excellent structural day to end the week.
The rally on Friday could be because the Fed's Robert Kaplan, who is influential among the group, changed his tone toward tapering, stating that the Delta variant was concerning and may have a prolonged impact on the economy. The rally may also have been because of the monthly options expiration. Or it may just be more speculative dip-buying. We won't know until next week when the market can decide where it goes next.
The Nasdaq declined -0.73% for the week. Volume was lower than the previous week. The closing range is 78%. Three weeks of long lower wicks show the presence of sellers as the index is at all-time highs.
The S&P 500 (SPX) declined -0.59%. The Dow Jones Industrial Average (DJI) lost -1.11%. The Russell 2000 (RUT) fell -2.50% for the week.
The VIX volatility index rose 60% mid-week but closed the week at a +19.99% gain.
Defensive sectors led throughout this week as the Market absorbed data that showed a slowing economic recovery and meeting minutes from the Fed that indicated tapering could begin this year.
Utilities ( XLU ) and Health Care ( XLV ) exchanged the lead several times, and the finish was close. Utilities became a favorite place for investors to keep money in equities while taking a defensive stance toward the economy. Health Care also did well as the world watches another wave of the pandemic brought on by the Delta variant of COVID.
Technology ( XLK ) also mixed in with the defensive sectors at the top of the list. Big tech seems to be another safe play for equity investors, with Microsoft ( MSFT ), Apple ( AAPL ), and Alphabet ( GOOGL ) all turning in strong financials and appear resilient to new waves of lockdowns.
Suffering the most from fears of economic slowdown and the pandemic, Energy ( XLE ) came in the last place for the week with a huge loss of over 7%.
Yields for the US 30y and 10y both declined this week while 2y Treasuries advanced.
Both High Yield Corporate Bond (HYG) prices dipped, and Investment Grade Bond (LQD) prices rose for the week. Both moves were small.
The US Dollar (DXY) advanced +1.01% for the week. The dollar is at its strongest in 2021.
Silver (SILVER) declined -2.94%, while Gold (GOLD) advanced +0.08%.
Crude Oil (CRUDEOIL1!) dropped -8.68%.
Timber (WOOD) declined -3.83%.
Copper (COPPER1!) declined -4.55%.
Aluminum (ALI1!) declined -1.97%.
-=x=-=x=-=x=-=x=-=x=-=x=-=x=-
Big Four Mega-caps
Microsoft (MSFT) beat the market this week with a +3.93% gain, helping send the Technology sector to new highs. The other four largest mega-caps took losses. Apple (AAPL) and Alphabet (GOOGL) declined -0.61% and -0.22%. The charts of these two companies look good, remaining above their 10-week moving average. Amazon (AMZN) continues to fall back after earnings a month ago. This week is declined -2.85% and closed below its 50w moving average.
-=x=-=x=-=x=-=x=-=x=-=x=-=x=-
Cryptocurrency
I started tracking four major cryptocurrencies on the week in review. The four are Bitcoin, Ethereum, Litecoin, and Bitcoin Cash. The latter two are not the largest by market cap but seem to be well-known and are part of the CIX capital.com index, tracking five cryptocurrencies, including these four (Ripple is the fifth).
Bitcoin (BTCUSD) outperformed the other cryptocurrencies this week with a +4.16% gain (time of writing). Ethereum (ETHUSD) declined -2.02%. Litecoin (LTCUSD) lost -1.01%. Bitcoin Cash (BCHUSD) fell -3.23%. Keep in mind that the US Dollar advanced 1.00% when considering these crypto prices with the USD as the denominator.
-=x=-=x=-=x=-=x=-=x=-=x=-=x=-
Investor Sentiment
The put/call ratio (PCCE) ended the week at 0.760, elevated from the previous week.
The CNN Fear & Greed Index moved back into Extreme Fear.
The NAAIM money manager exposure index dropped to 70.57 this week.
-=x=-=x=-=x=-=x=-=x=-=x=-=x=-
The Week Ahead
Monday
Manufacturing and Services Purchasing Managers Index data will be available on Monday, just after the market opens. Existing Home Sales data will also be available.
JD.com (JD) releases earnings on Monday.
Tuesday
New Home Sales will be available on Tuesday morning. API Weekly Crude Oil Stock comes after the market closes.
Medtronic (MDT), Intuit (INTU), Pinduoduo (PDD), and Best Buy (BBY) are some of the earnings reports to watch for Tuesday.
Wednesday
Durable Goods Orders on Wednesday give another look at the pace of economic growth. Crude Oil Inventories will also be available after the market open. Higher demand would be a positive for oil and the energy sector.
Salesforce.com (CRM), Snowflake (SNOW), Autodesk (ADSK), and Ehang Holdings (EH) are some of the interesting earnings reports on Wednesday.
Thursday
The weekly Initial Jobless Claims numbers will be available before the market opens on Thursday. An update to the Q2 GDP numbers will also be released, which are expected to be slightly higher than the previous preliminary data.
Thursday's earnings reports include Dell (DELL), VMWare (VMW), Workday (WDAY), Dollar General (DG), Woolworths (WOLZY), Peloton Interactive (PTON), Dollar Tree (DLTR), Gap (GPS), and UP Fintech (TIGR).
Friday
There are two important sets of economic data to watch for on Friday. PCE Price Index data is a primary indicator of inflation. The data will be available before the market opens. After the market opens, attention will turn to the update for Michigan Consumer Sentiment numbers for August. The preliminary numbers two weeks ago were well below expectation.
Big Lots (BIG) releases earnings on Friday morning.
-=x=-=x=-=x=-=x=-=x=-=x=-=x=-
The Bullish Side
The market certainly turned more bearish this week. However, there are still some bullish signals. First, negative reactions to disappointing economic data were short-lived, and even the revelation that the Fed might start tapering economic support only had a temporary impact. The reality is there are not so many great places for investors to put money other than in equities right now. That resulted in them finding the safest bets within equities, which sent defensive sectors higher and boosted high-performing tech companies.
Although there will be some impact if the Fed begins to taper, the reason for tapering is a strong economy. If jobs data shows full employment on the horizon, we should see a pickup in consumer and corporate spending. Both groups still have cash and debt to burn. That all equals growth.
Inflation has shown signs of cooling off, and we'll get another look at the numbers on Friday. Although consumers are still feeling inflation at the register, there is likely oversupply across the supply chain and even into consumer homes. That extra supply could mean inflation slowing or even has a period of deflation.
-=x=-=x=-=x=-=x=-=x=-=x=-=x=-
The Bearish Side
The pandemic is wearing on the consumers and the economy. With the Delta variant rising in numbers, the outlook continues to dim. Although new lockdowns in the US are likely not on the horizon, the mood for consumers is keeping people home, impacting the service sectors.
Across the board, data is showing a slowing economy. Retail sales were lower than forecast. Commodities this week all moved lower. Consumer sentiment is lower than during the height of the pandemic.
The Nasdaq rebound off the intra-week low to end the week with a gain on Friday. That could just be a retracement before another move downward next week. Investor sentiment is low, and any bad news may be the final straw before a more significant correction.
-=x=-=x=-=x=-=x=-=x=-=x=-=x=-
Key Nasdaq Levels to Watch
The Nasdaq dipped below the 21d EMA and 50d MA but recovered and closed above both key moving average lines.
On the positive side, the levels are:
On the downside, there are a few key levels:
-=x=-=x=-=x=-=x=-=x=-=x=-=x=-
Wrap-up
It was not an easy week for investors. Economic and geopolitical bad news piled up, and the Fed meeting minutes added to the worries of tapering. Still, it seems investors are sticking to equities. As investors do not have many places to put money, that means they'll be continuously rotating within market sectors to find the best places to get returns. Expect to feel dizzy as you watch your favorite stocks churn.
Good luck, stay healthy, and trade safe!
Notes
- The Market Week in Review is my weekend homework where I look over what happened in the previous week and what might come in the next week.
- I occasionally have some errors or typos and will correct them in my blog or the comments on TradingView. I do not have an editor and do this in my free time.
- If you find this helpful, please let me know in the comments. I am also more than happy to add new perspectives and data points if you have ideas.
The structure is the following:
- A recap of the daily updates that I do here on TradingView.
- View on the past week
- What's coming in the next week
- The Bullish View, The Bearish View
- Key index levels to watch out for
- Wrap-up
If you have been following my daily updates, you can skip down to "View on the Week." If not, then this first part is a great play-by-play recap for the week. Click the daily charts for more detail on sectors, indexes, and market leaders each day.
-=x=-=x=-=x=-=x=-=x=-=x=-=x=-
Monday, August 16, 2021
Facts: -0.20%, Volume lower, Closing range: 100%, Body: 12%
Good: Volume lower on retreat, high closing range
Bad: Long lower wick pierced through 21d EMA
Highs/Lows: Lower high, lower low
Candle: Hanging man, small body above long lower wick within uptrend
Advanced/Decline: 0.31, more than three declining stocks for every advancing stock
Indexes: SPX (+0.26%), DJI (+0.31%), RUT (-0.89%), VIX (+4.20%)
Sectors: Health (XLV +1.14%) and Utilities (XLU +0.61%)
at the top. Materials (XLB -0.50%) and Energy (XLE -1.84%) at the bottom.
Expectation: Sideways or Lower
Investors sold off equities in the morning and then seemingly decided there was nowhere else to put the money and bought back assets in the afternoon. Money moved back into the market, mostly into defensive sectors, sending the S&P 500 and Dow Jones Industrial (DJI) to another set of records.
The Nasdaq closed with a decline of -0.20% after dipping more than 1.4% in the morning. Volume was lower than the previous day. The thin body above a long lower wick creates a hanging man candlestick within an uptrend. The closing range of 100% shows bulls kept up the buying into close. Still, there were more than three declining stocks for every advancing stock for the day.
-=x=-=x=-=x=-=x=-=x=-=x=-=x=-
Tuesday, August 17, 2021

Facts: -0.93%, Volume higher, Closing range: 63%, Body: 9%
Good: Stayed above 50d MA
Bad: Break down below 21d EMA on higher volume
Highs/Lows: Lower high, lower low
Candle: Thin red body in upper half of candle, longer lower wick
Advanced/Decline: 0.32, more than three declining stocks for every advancing stock
Indexes: SPX (-0.71%), DJI (-0.79%), RUT (-1.19%), VIX (+11.24%)
Sectors: Health (XLV +1.18%) and Real Estate (XLRE +0.19%) at the top. Materials (XLB -1.15%) and Consumer Discretionary (XLY -2.37%) at the bottom.
Expectation: Lower
Disappointing retail sales data confirmed fears that the rising cases of the Delta variant are slowing down the economic recovery. That sent major indexes lower on Tuesday. Only the defensive sectors ended the day with gains.
The Nasdaq closed with a -0.93% loss on higher volume than the previous day, marking a distribution day for the index. The candle has a thin red body in the upper half of the candle. The closing range is 63%, and the body only covers 9% of the candle. The lower wick is longer than the upper wick. There were more than three declining stocks for every advancing stock on the Nasdaq.
-=x=-=x=-=x=-=x=-=x=-=x=-=x=-
Wednesday, August 18, 2021

Facts: -0.89%, Volume lower, Closing range: 5%, Body: 61%
Good: Lower volume
Bad: Close below the 50d MA, sell-off before close of market
Highs/Lows: Lower high, lower low
Candle: Large red body below short upper wick
Advanced/Decline: 0.38, nearly three declining stocks for every advancing stock
Indexes: SPX (-1.07%), DJI (-1.08%), RUT (-0.84%), VIX (+20.32%)
Sector List: Consumer Discretionary (XLY +0.36%) and Utilities (XLU -0.51%) at the top. Health (XLV -1.52%) and Energy (XLE -2.08%) at the bottom.
Expectation: Lower
Stocks slid after the Fed released meeting minutes from last month, raising fears that tapering support for the economy could come earlier than previously thought. Most sectors declined, with only Consumer Discretionary holding onto a gain for the day.
The Nasdaq closed with a -0.89% loss, dipping just below the 50-day moving average line. Volume was lower than the previous day. The closing range of 5% is below a 61% red body. There is a short upper wick with a very tiny lower wick. There were almost three stocks declining for every advancing stock.
-=x=-=x=-=x=-=x=-=x=-=x=-=x=-
Thursday, August 19, 2021
Facts: +0.11%, Volume higher, Closing range: 63%, Body: 63%
Good: Higher volume on gain, close near the 50d MA
Bad: Lower high, lower low continues downtrend
Highs/Lows: Lower high, lower low
Candle: No lower wick, large green body underneath upper wick
Advanced/Decline: 0.28, over three declining stocks for every advancing stock
Indexes: SPX (+0.13%), DJI (-0.19%), RUT (-1.22%), VIX (+0.46%)
Sector List: Technology (XLK +0.98%) and Real Estate (XLRE +0.84%) at the top. Materials (XLB -0.89%) and Energy (XLE -2.60%) at the bottom.
Expectation: Lower
Investors grappled today with reactions to the Fed meeting minutes released late on Wednesday. The minutes showed several officials in the Fed see the possibility that a key employment goal may be met before year-end and would allow tapering to begin. The result was a dip at open followed by a volatile day as the market priced in the impact.
The Nasdaq cleared a small gain for the day, advancing +0.11% and closing at the 50-day moving average line. Volume was higher than the previous day. The candle has no lower wick, a 63% green body, and a 37% upper wick. The index could not hold onto the gains from the morning rally. Despite the slight increase, there were more than three declining stocks for every advancing stock.
-=x=-=x=-=x=-=x=-=x=-=x=-=x=-
Friday, August 20, 2021

Facts: +1.19%, Volume lower, Closing Range: 95%, Body: 95% Green
Good: All green body, high advance/decline ratio
Bad: Lower volume
Highs/Lows: Higher high, Higher low
Candle: Mostly green body with a tiny upper wick, low above yesterday's close
Advance/Decline: 1.68, three advancing stocks for every two declining stocks
Indexes: SPX (+0.81%), DJIA (+0.65%), RUT (+1.65%), VIX (-14.35%)
Sector List: Technology (XLK +1.29%) and Utilities (XLU +1.25%) at the top. Energy (XLE +0.22%) and Consumer Staples (XLP +0.17%) at the bottom.
Expectation: Higher
The market shrugged off worries about the Fed tapering of economic support to rally higher today. While the indexes were still below recent highs, the day was an excellent structural day, with gains shared broadly across the market.
The Nasdaq closed +1.19% higher. Volume was lower than the previous day. The candle is almost entirely green body, with a short upper wick. The closing range of 95% and 95% body creates the second candle in a row with no lower wick. The index closed back above its 21d EMA as three stocks advanced for every two that declined.
-=x=-=x=-=x=-=x=-=x=-=x=-=x=-
View on the Week
Fears of a slowing economic recovery among rising cases of the Delta variant drove investors through a volatile week in the stock market. To make things worse, the Fed meeting minutes indicated that tapering could begin within this year. Despite the bad news, investors stuck with equities but rotated into defensive sectors.
It opened on Monday with news of China retail sales falling much lower than expected. That sent indexes lower on Monday before prices recovered from the shocking news. Despite the dip, the S&P 500 and Dow Jones Industrial Average had another record close for the day.
The bounce was short-lived. Tuesday brought the US Retail Sales data, which also came in lower than expected. That turned many bulls into bears, and the indexes moved lower and with higher volume. The Nasdaq closed below its 21d exponential moving average line.
It seemed all was clear on Wednesday as buyers came back into the market, but then the Fed released meeting minutes in the afternoon that reversed the dip-buying. The Fed's minutes showed several Fed officials believed that tapering could start this year as key economic recovery goals were being met. The index sold off to close below its 50d moving average line.
The selling resulted in a gap down at open on Thursday, but the sudden drop below 14,500 seemed enough to get investors back into the game, and the opening price became the low of the day. The rally took the Nasdaq back above its 50d moving average but then faded to close below. Given the fade and the lower high and lower low for the day, the expectation was still for the Nasdaq to move lower on Friday.
That did not happen. Instead, the index opened above the 50d moving average and rose the entire day to close above its 21d exponential moving average. There were more advancing stocks than declining stocks, and all sectors gained. That was an excellent structural day to end the week.
The rally on Friday could be because the Fed's Robert Kaplan, who is influential among the group, changed his tone toward tapering, stating that the Delta variant was concerning and may have a prolonged impact on the economy. The rally may also have been because of the monthly options expiration. Or it may just be more speculative dip-buying. We won't know until next week when the market can decide where it goes next.
The Nasdaq declined -0.73% for the week. Volume was lower than the previous week. The closing range is 78%. Three weeks of long lower wicks show the presence of sellers as the index is at all-time highs.
The S&P 500 (SPX) declined -0.59%. The Dow Jones Industrial Average (DJI) lost -1.11%. The Russell 2000 (RUT) fell -2.50% for the week.
The VIX volatility index rose 60% mid-week but closed the week at a +19.99% gain.
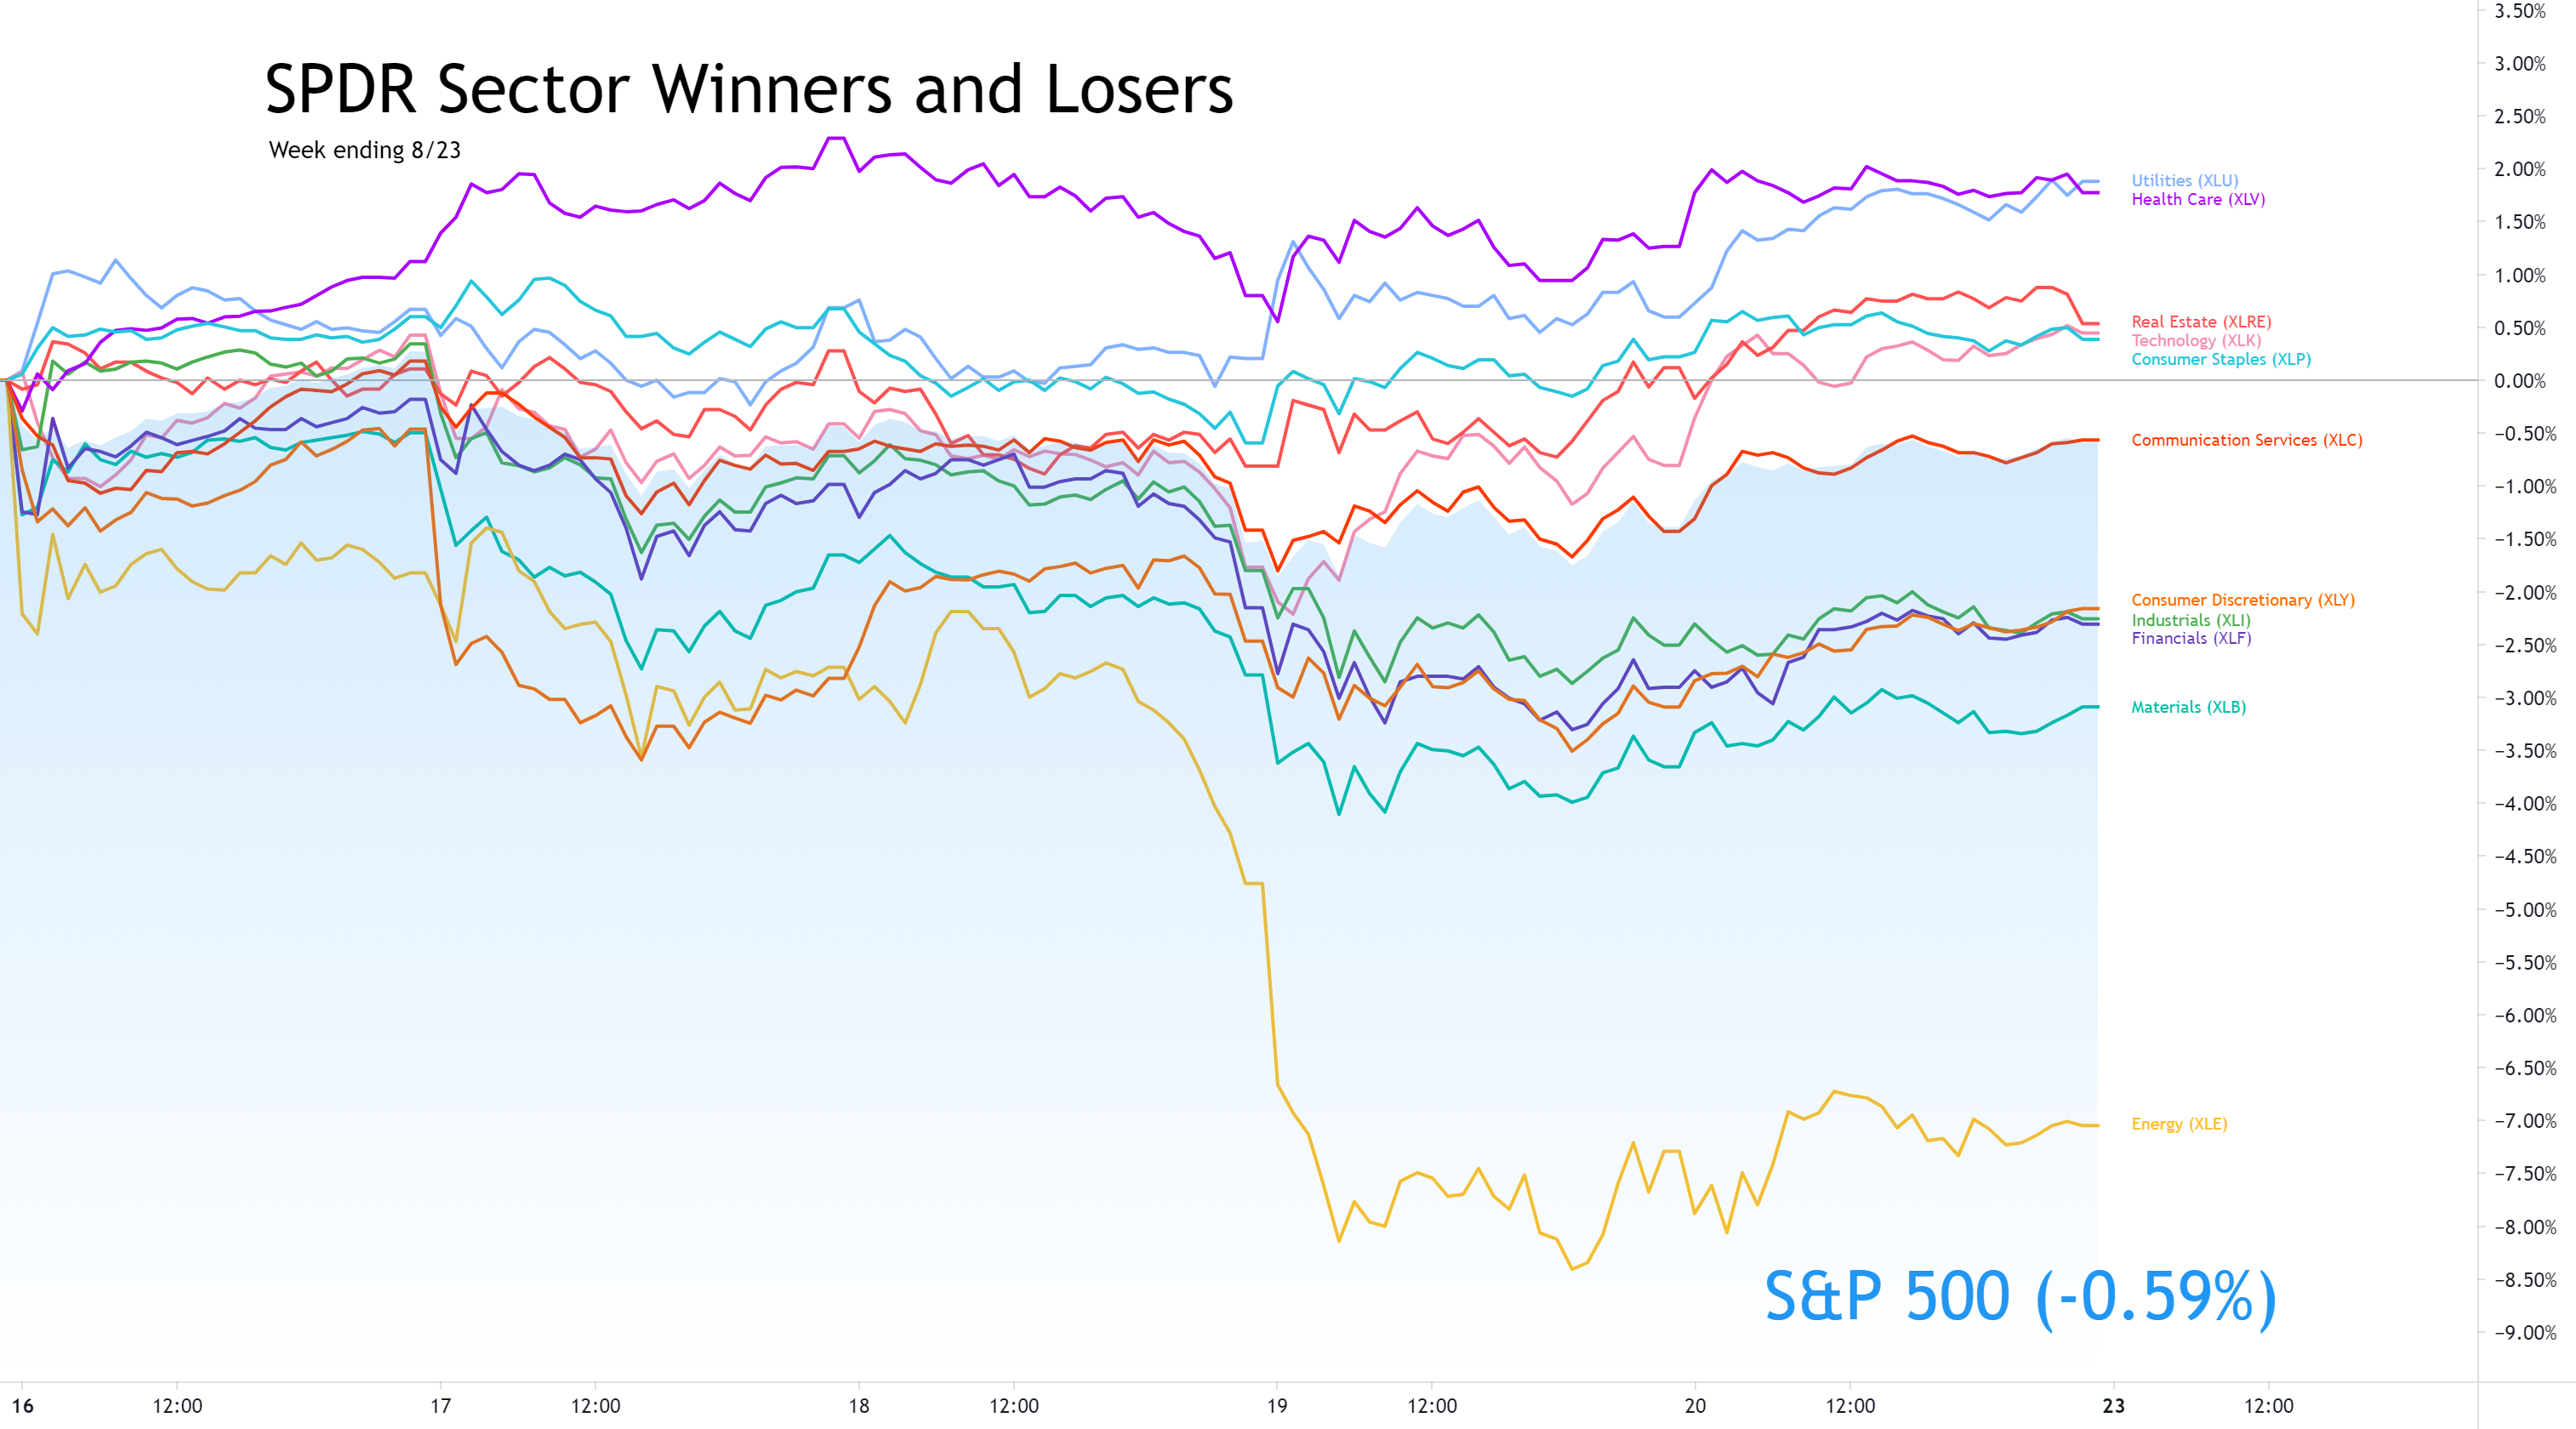
Defensive sectors led throughout this week as the Market absorbed data that showed a slowing economic recovery and meeting minutes from the Fed that indicated tapering could begin this year.
Utilities ( XLU ) and Health Care ( XLV ) exchanged the lead several times, and the finish was close. Utilities became a favorite place for investors to keep money in equities while taking a defensive stance toward the economy. Health Care also did well as the world watches another wave of the pandemic brought on by the Delta variant of COVID.
Technology ( XLK ) also mixed in with the defensive sectors at the top of the list. Big tech seems to be another safe play for equity investors, with Microsoft ( MSFT ), Apple ( AAPL ), and Alphabet ( GOOGL ) all turning in strong financials and appear resilient to new waves of lockdowns.
Suffering the most from fears of economic slowdown and the pandemic, Energy ( XLE ) came in the last place for the week with a huge loss of over 7%.
Yields for the US 30y and 10y both declined this week while 2y Treasuries advanced.
Both High Yield Corporate Bond (HYG) prices dipped, and Investment Grade Bond (LQD) prices rose for the week. Both moves were small.
The US Dollar (DXY) advanced +1.01% for the week. The dollar is at its strongest in 2021.
Silver (SILVER) declined -2.94%, while Gold (GOLD) advanced +0.08%.
Crude Oil (CRUDEOIL1!) dropped -8.68%.
Timber (WOOD) declined -3.83%.
Copper (COPPER1!) declined -4.55%.
Aluminum (ALI1!) declined -1.97%.
-=x=-=x=-=x=-=x=-=x=-=x=-=x=-
Big Four Mega-caps
Microsoft (MSFT) beat the market this week with a +3.93% gain, helping send the Technology sector to new highs. The other four largest mega-caps took losses. Apple (AAPL) and Alphabet (GOOGL) declined -0.61% and -0.22%. The charts of these two companies look good, remaining above their 10-week moving average. Amazon (AMZN) continues to fall back after earnings a month ago. This week is declined -2.85% and closed below its 50w moving average.
-=x=-=x=-=x=-=x=-=x=-=x=-=x=-
Cryptocurrency
I started tracking four major cryptocurrencies on the week in review. The four are Bitcoin, Ethereum, Litecoin, and Bitcoin Cash. The latter two are not the largest by market cap but seem to be well-known and are part of the CIX capital.com index, tracking five cryptocurrencies, including these four (Ripple is the fifth).
Bitcoin (BTCUSD) outperformed the other cryptocurrencies this week with a +4.16% gain (time of writing). Ethereum (ETHUSD) declined -2.02%. Litecoin (LTCUSD) lost -1.01%. Bitcoin Cash (BCHUSD) fell -3.23%. Keep in mind that the US Dollar advanced 1.00% when considering these crypto prices with the USD as the denominator.
-=x=-=x=-=x=-=x=-=x=-=x=-=x=-
Investor Sentiment
The put/call ratio (PCCE) ended the week at 0.760, elevated from the previous week.
The CNN Fear & Greed Index moved back into Extreme Fear.
The NAAIM money manager exposure index dropped to 70.57 this week.
-=x=-=x=-=x=-=x=-=x=-=x=-=x=-
The Week Ahead
Monday
Manufacturing and Services Purchasing Managers Index data will be available on Monday, just after the market opens. Existing Home Sales data will also be available.
JD.com (JD) releases earnings on Monday.
Tuesday
New Home Sales will be available on Tuesday morning. API Weekly Crude Oil Stock comes after the market closes.
Medtronic (MDT), Intuit (INTU), Pinduoduo (PDD), and Best Buy (BBY) are some of the earnings reports to watch for Tuesday.
Wednesday
Durable Goods Orders on Wednesday give another look at the pace of economic growth. Crude Oil Inventories will also be available after the market open. Higher demand would be a positive for oil and the energy sector.
Salesforce.com (CRM), Snowflake (SNOW), Autodesk (ADSK), and Ehang Holdings (EH) are some of the interesting earnings reports on Wednesday.
Thursday
The weekly Initial Jobless Claims numbers will be available before the market opens on Thursday. An update to the Q2 GDP numbers will also be released, which are expected to be slightly higher than the previous preliminary data.
Thursday's earnings reports include Dell (DELL), VMWare (VMW), Workday (WDAY), Dollar General (DG), Woolworths (WOLZY), Peloton Interactive (PTON), Dollar Tree (DLTR), Gap (GPS), and UP Fintech (TIGR).
Friday
There are two important sets of economic data to watch for on Friday. PCE Price Index data is a primary indicator of inflation. The data will be available before the market opens. After the market opens, attention will turn to the update for Michigan Consumer Sentiment numbers for August. The preliminary numbers two weeks ago were well below expectation.
Big Lots (BIG) releases earnings on Friday morning.
-=x=-=x=-=x=-=x=-=x=-=x=-=x=-
The Bullish Side
The market certainly turned more bearish this week. However, there are still some bullish signals. First, negative reactions to disappointing economic data were short-lived, and even the revelation that the Fed might start tapering economic support only had a temporary impact. The reality is there are not so many great places for investors to put money other than in equities right now. That resulted in them finding the safest bets within equities, which sent defensive sectors higher and boosted high-performing tech companies.
Although there will be some impact if the Fed begins to taper, the reason for tapering is a strong economy. If jobs data shows full employment on the horizon, we should see a pickup in consumer and corporate spending. Both groups still have cash and debt to burn. That all equals growth.
Inflation has shown signs of cooling off, and we'll get another look at the numbers on Friday. Although consumers are still feeling inflation at the register, there is likely oversupply across the supply chain and even into consumer homes. That extra supply could mean inflation slowing or even has a period of deflation.
-=x=-=x=-=x=-=x=-=x=-=x=-=x=-
The Bearish Side
The pandemic is wearing on the consumers and the economy. With the Delta variant rising in numbers, the outlook continues to dim. Although new lockdowns in the US are likely not on the horizon, the mood for consumers is keeping people home, impacting the service sectors.
Across the board, data is showing a slowing economy. Retail sales were lower than forecast. Commodities this week all moved lower. Consumer sentiment is lower than during the height of the pandemic.
The Nasdaq rebound off the intra-week low to end the week with a gain on Friday. That could just be a retracement before another move downward next week. Investor sentiment is low, and any bad news may be the final straw before a more significant correction.
-=x=-=x=-=x=-=x=-=x=-=x=-=x=-
Key Nasdaq Levels to Watch
The Nasdaq dipped below the 21d EMA and 50d MA but recovered and closed above both key moving average lines.
On the positive side, the levels are:
- The 10d moving average is at 14,728.49.
- The all-time high of 14,896.47 is the level to pass and continue the bull run.
- The round number 15,000 is likely to be a new area of resistance.
On the downside, there are a few key levels:
- The 21d EMA is at 14,714.66.
- The 50d MA is at 14,562.73.
- 14,423.16 is the low of the past week.
- 14,200 remains a critical level if the index moves downward.
- 14,000 has been an area of support/resistance.
- There is a pivot at 13,903.73, which
- A further pullback would likely hit the 200d moving average at 13,548.93. The index hasn't approached this line since rising above it in April 2020.
-=x=-=x=-=x=-=x=-=x=-=x=-=x=-
Wrap-up
It was not an easy week for investors. Economic and geopolitical bad news piled up, and the Fed meeting minutes added to the worries of tapering. Still, it seems investors are sticking to equities. As investors do not have many places to put money, that means they'll be continuously rotating within market sectors to find the best places to get returns. Expect to feel dizzy as you watch your favorite stocks churn.
Good luck, stay healthy, and trade safe!