Summary: It was a great week across all major indexes. The week opened with a gain on Monday that erased losses from the prior Friday. Once investors had a chance to absorb the new Fed hawkish stance and get past a quadruple witching day, they were ready to push back into growth stocks and see the markets another step upward.
Notes
The structure is the following:
If you have been following my daily updates, you can skip down to "View on the Week." If not, then this first part is a great play-by-play recap for the week. Click the daily charts for more detail on sectors, indexes, and market leaders each day.
-=x=-=x=-=x=-=x=-=x=-=x=-=x=-
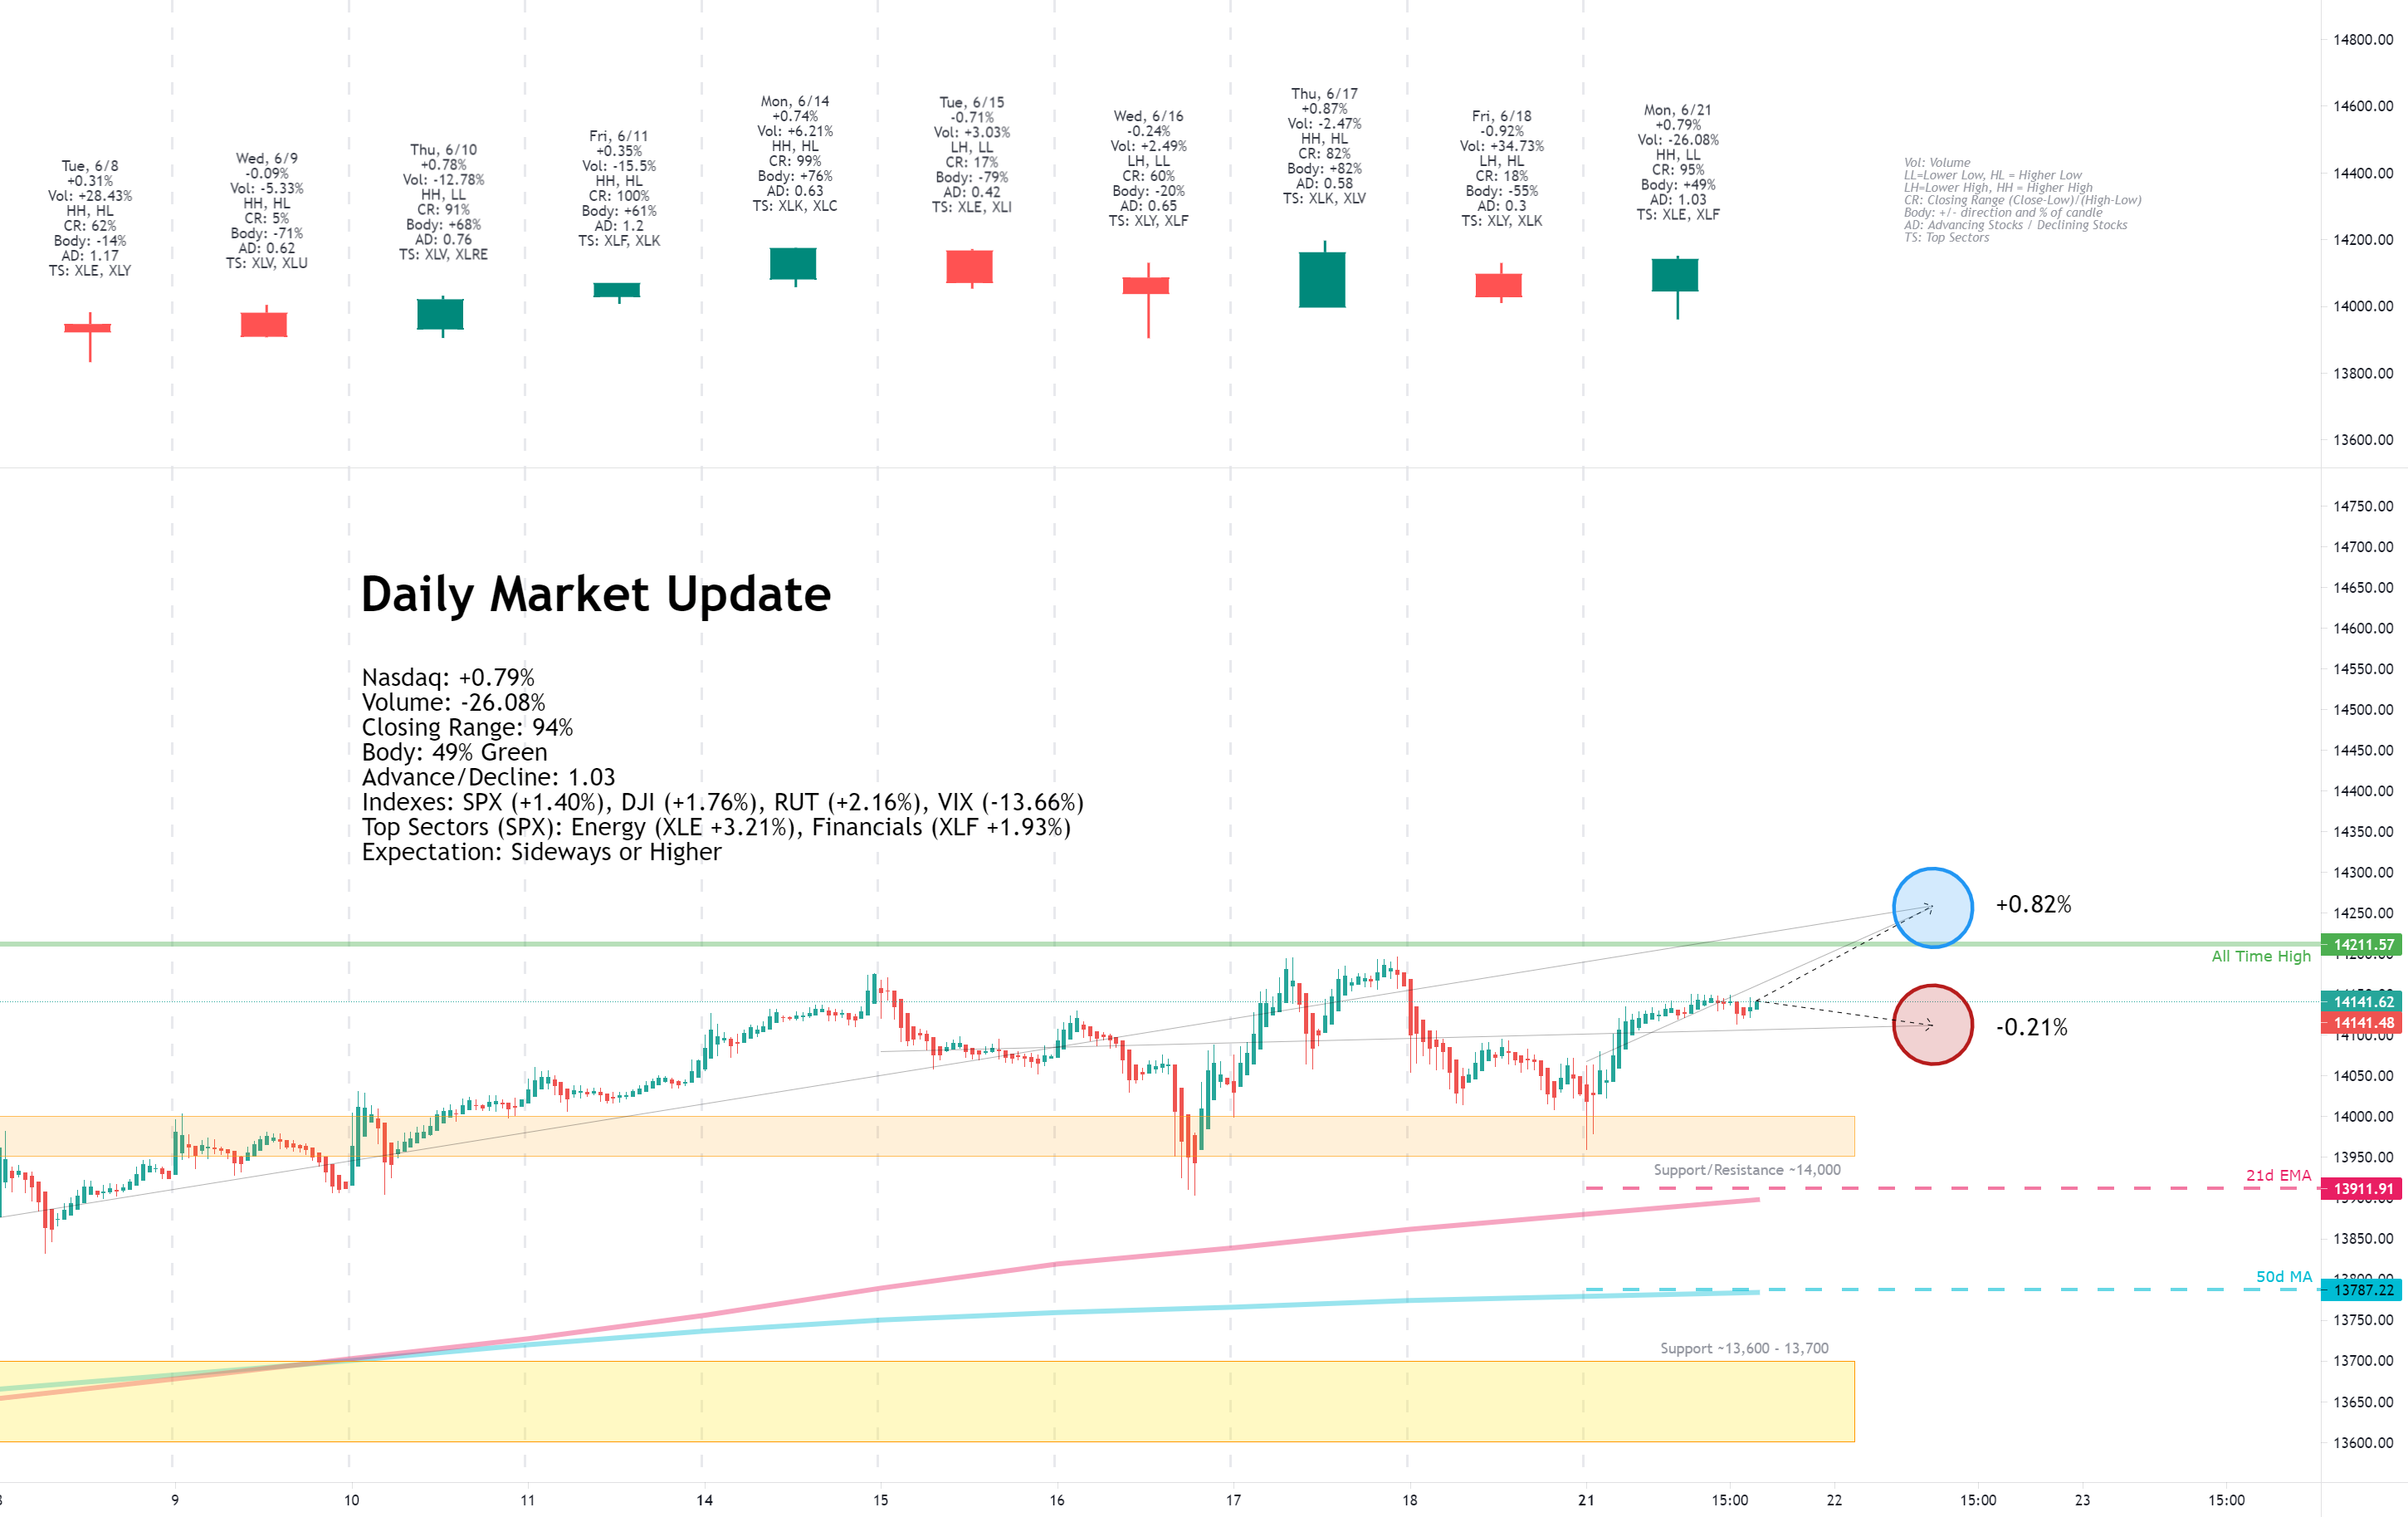
Monday, June 21, 2021

Facts: +0.79%, Volume higher, Closing range: 95%, Body: 49%
Good: Higher high, long lower wick from bullish rebound off morning low
Bad: Lower low, otherwise not much
Highs/Lows: Higher high, lower low
Candle: Half green body with long lower wick, small upper wick
Advanced/Decline: 1.03, One advancing stock for each declining stock
Indexes: SPX (+1.40%), DJI (+1.76%), RUT (+2.16%), VIX (-13.66%)
Sectors: Energy (XLE +3.21%) and Financials (XLF +1.93%) were top. Utilities (XLU +0.51%) and Consumer Staples (XLP +0.49%) were bottom.
Expectation: Sideways or Higher
Investors moved back into equities on Monday, helping markets rebound from Friday's sell-off. All major indexes and sectors moved higher while stocks ended the day balanced across gains and losses.
The Nasdaq closed with a +0.79% gain. The volume was lower than Friday's unusually high volume. The 49% body is in the upper half of the candle, above a long lower wick formed just after the market open. The index dropped after open, but found support around 14,000 and moved higher the rest of the day. There were about the same number of advancing stocks as declining stocks.
-=x=-=x=-=x=-=x=-=x=-=x=-=x=-
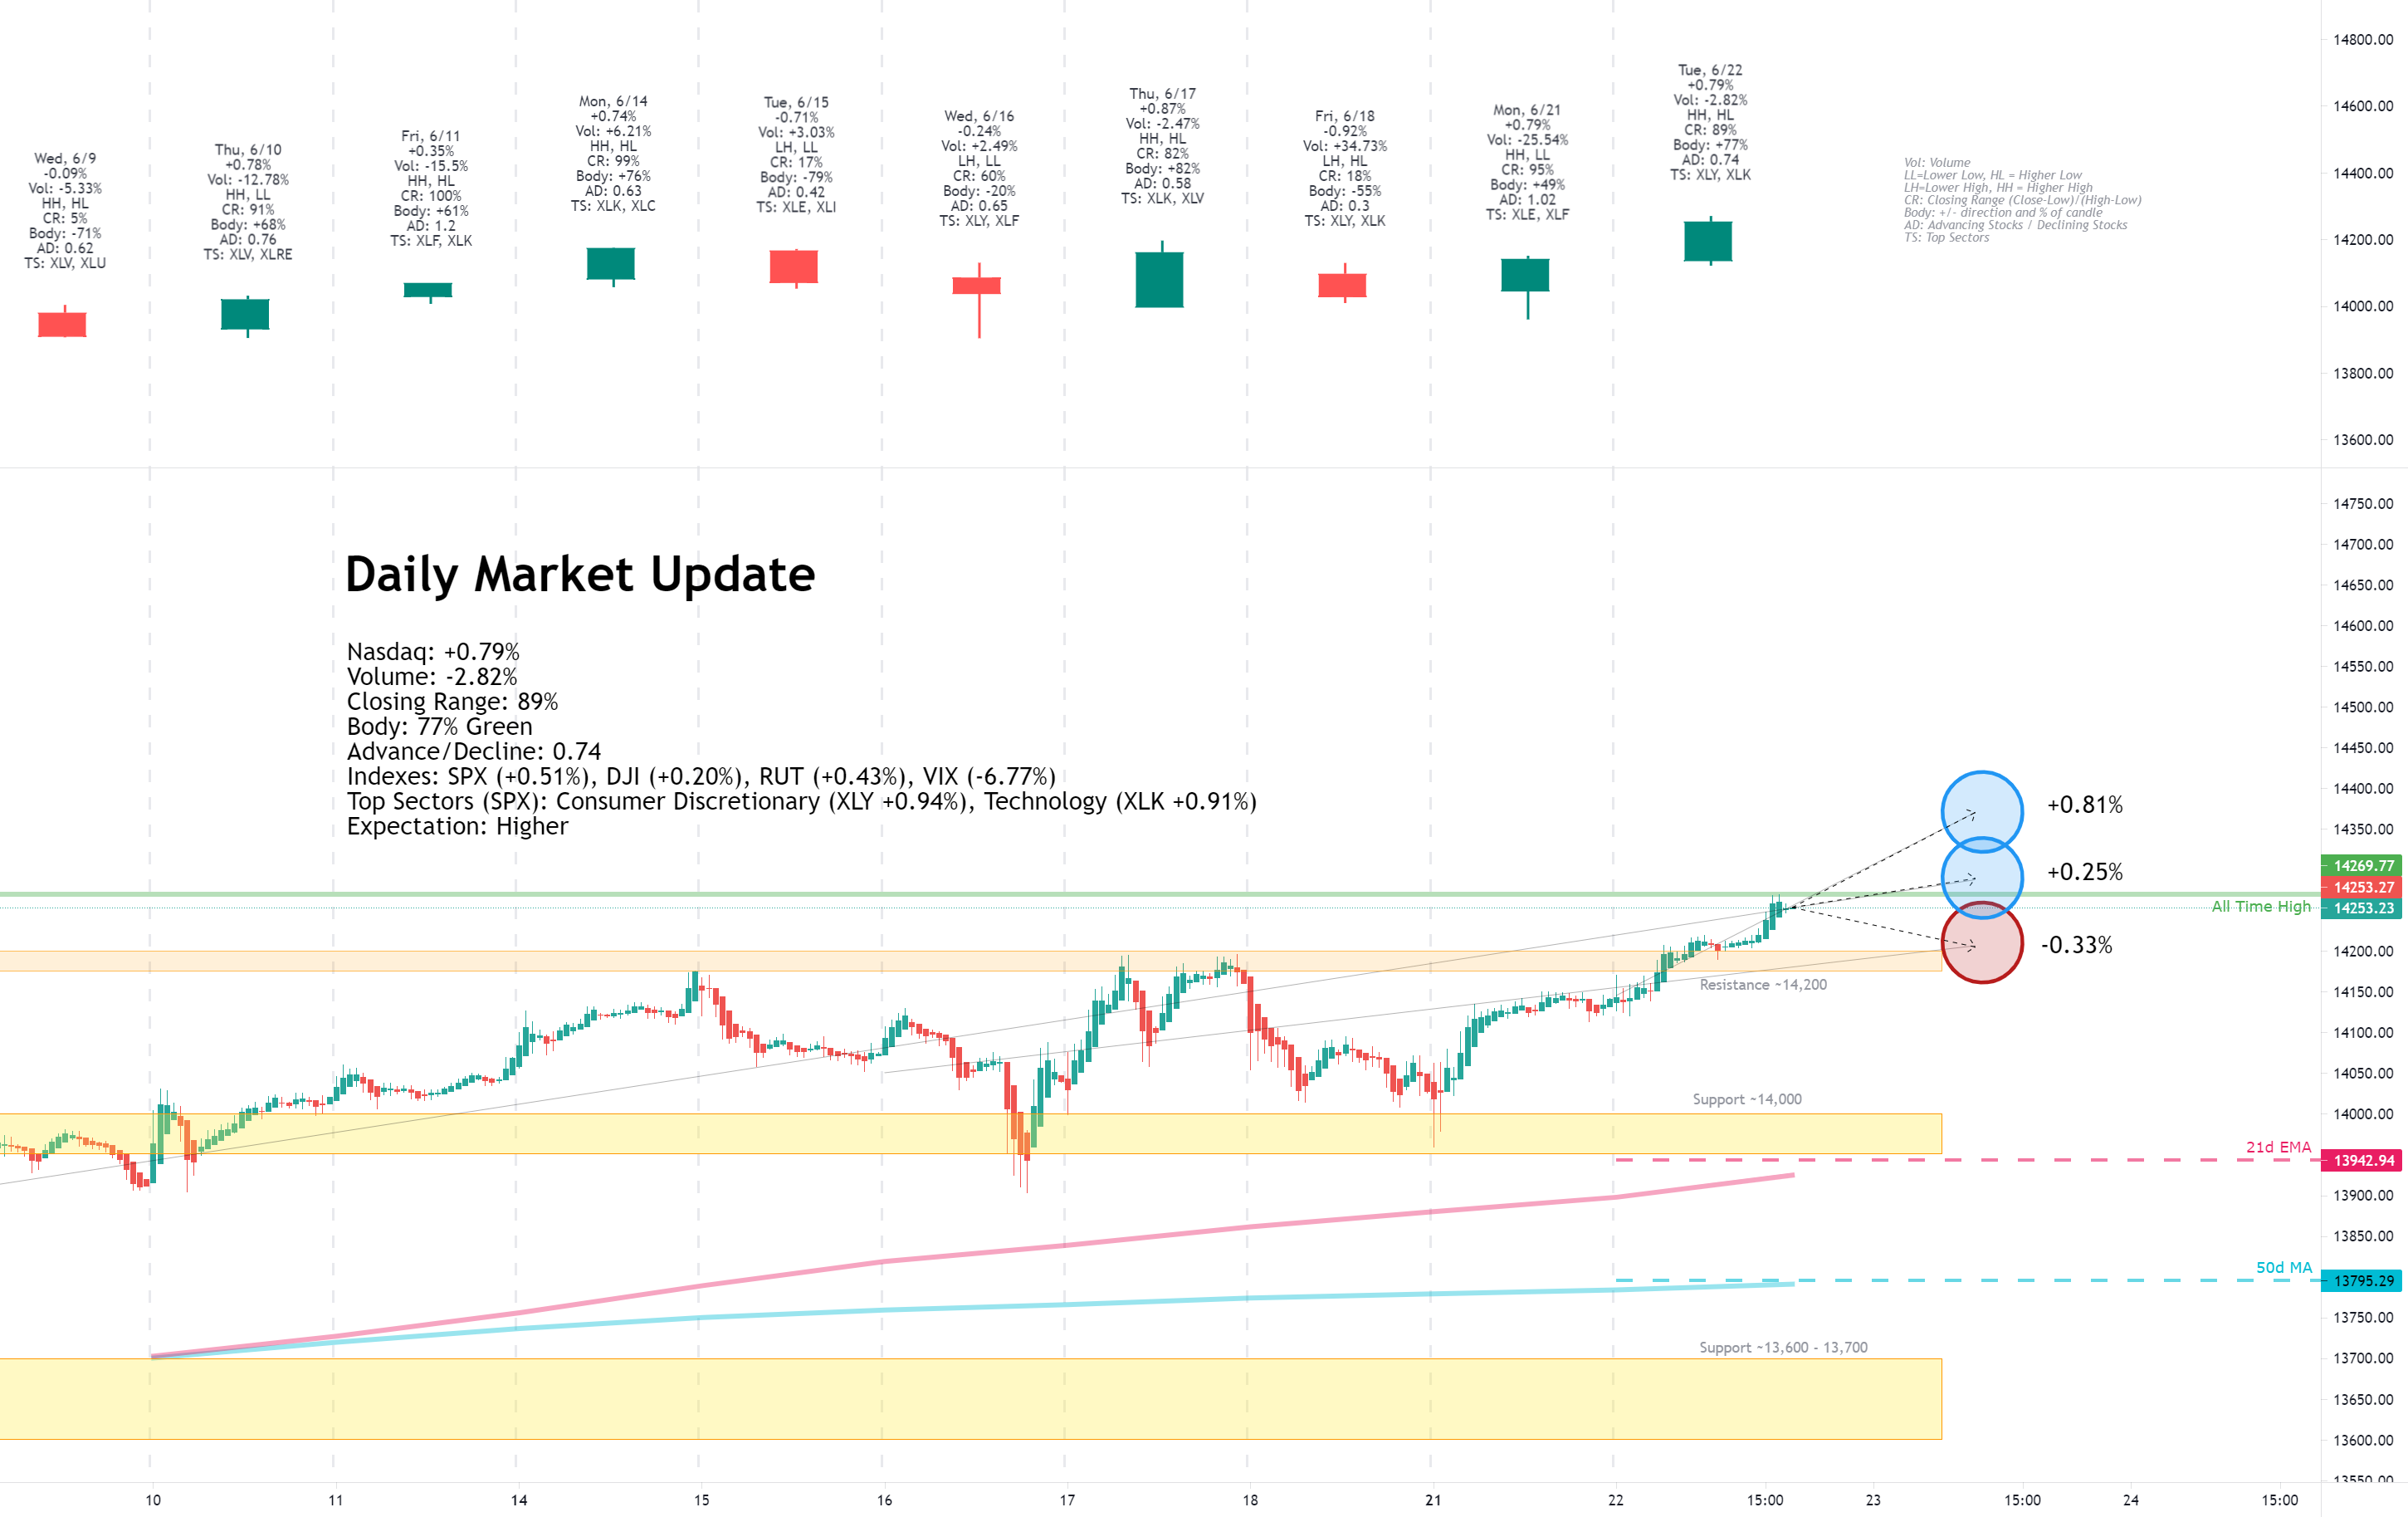
Tuesday, June 22, 2021
Facts: +0.79%, Volume lower, Closing range: 89%, Body: 77%
Good: New all-time high, thick green body, small wicks
Bad: A/D ratio, lower volume
Highs/Lows: Higher high, higher low
Candle: Mostly green body with short upper and lower wicks
Advanced/Decline: 0.74, More declining stocks than advancing stocks
Indexes: SPX (+0.51%), DJI (+0.20%), RUT (+0.43%), VIX (-6.77%)
Sectors: Consumer Discretionary (XLY +0.94%) and Technology (XLK +0.91%) were top. Real Estate (XLRE -0.45%) and Utilities (XLU -0.61%) were bottom.
Expectation: Higher
It was a record-setting day for the Nasdaq, setting a new all-time high for the first time since April. The other major indexes also had good gains for the day, while the sector list mainly was positive. Investors responded to better than expected existing home sales data and no new surprises from Fed Jerome Powell's testimony to congress.
The Nasdaq gained +0.79% for the day and finished the day with its highest close since April. The closing range of 89% and 77% green body represents a bullish session that only paused mid-day to await Powell's comments. Despite the bullish day, there were more declining stocks than advancing stocks.
-=x=-=x=-=x=-=x=-=x=-=x=-=x=-
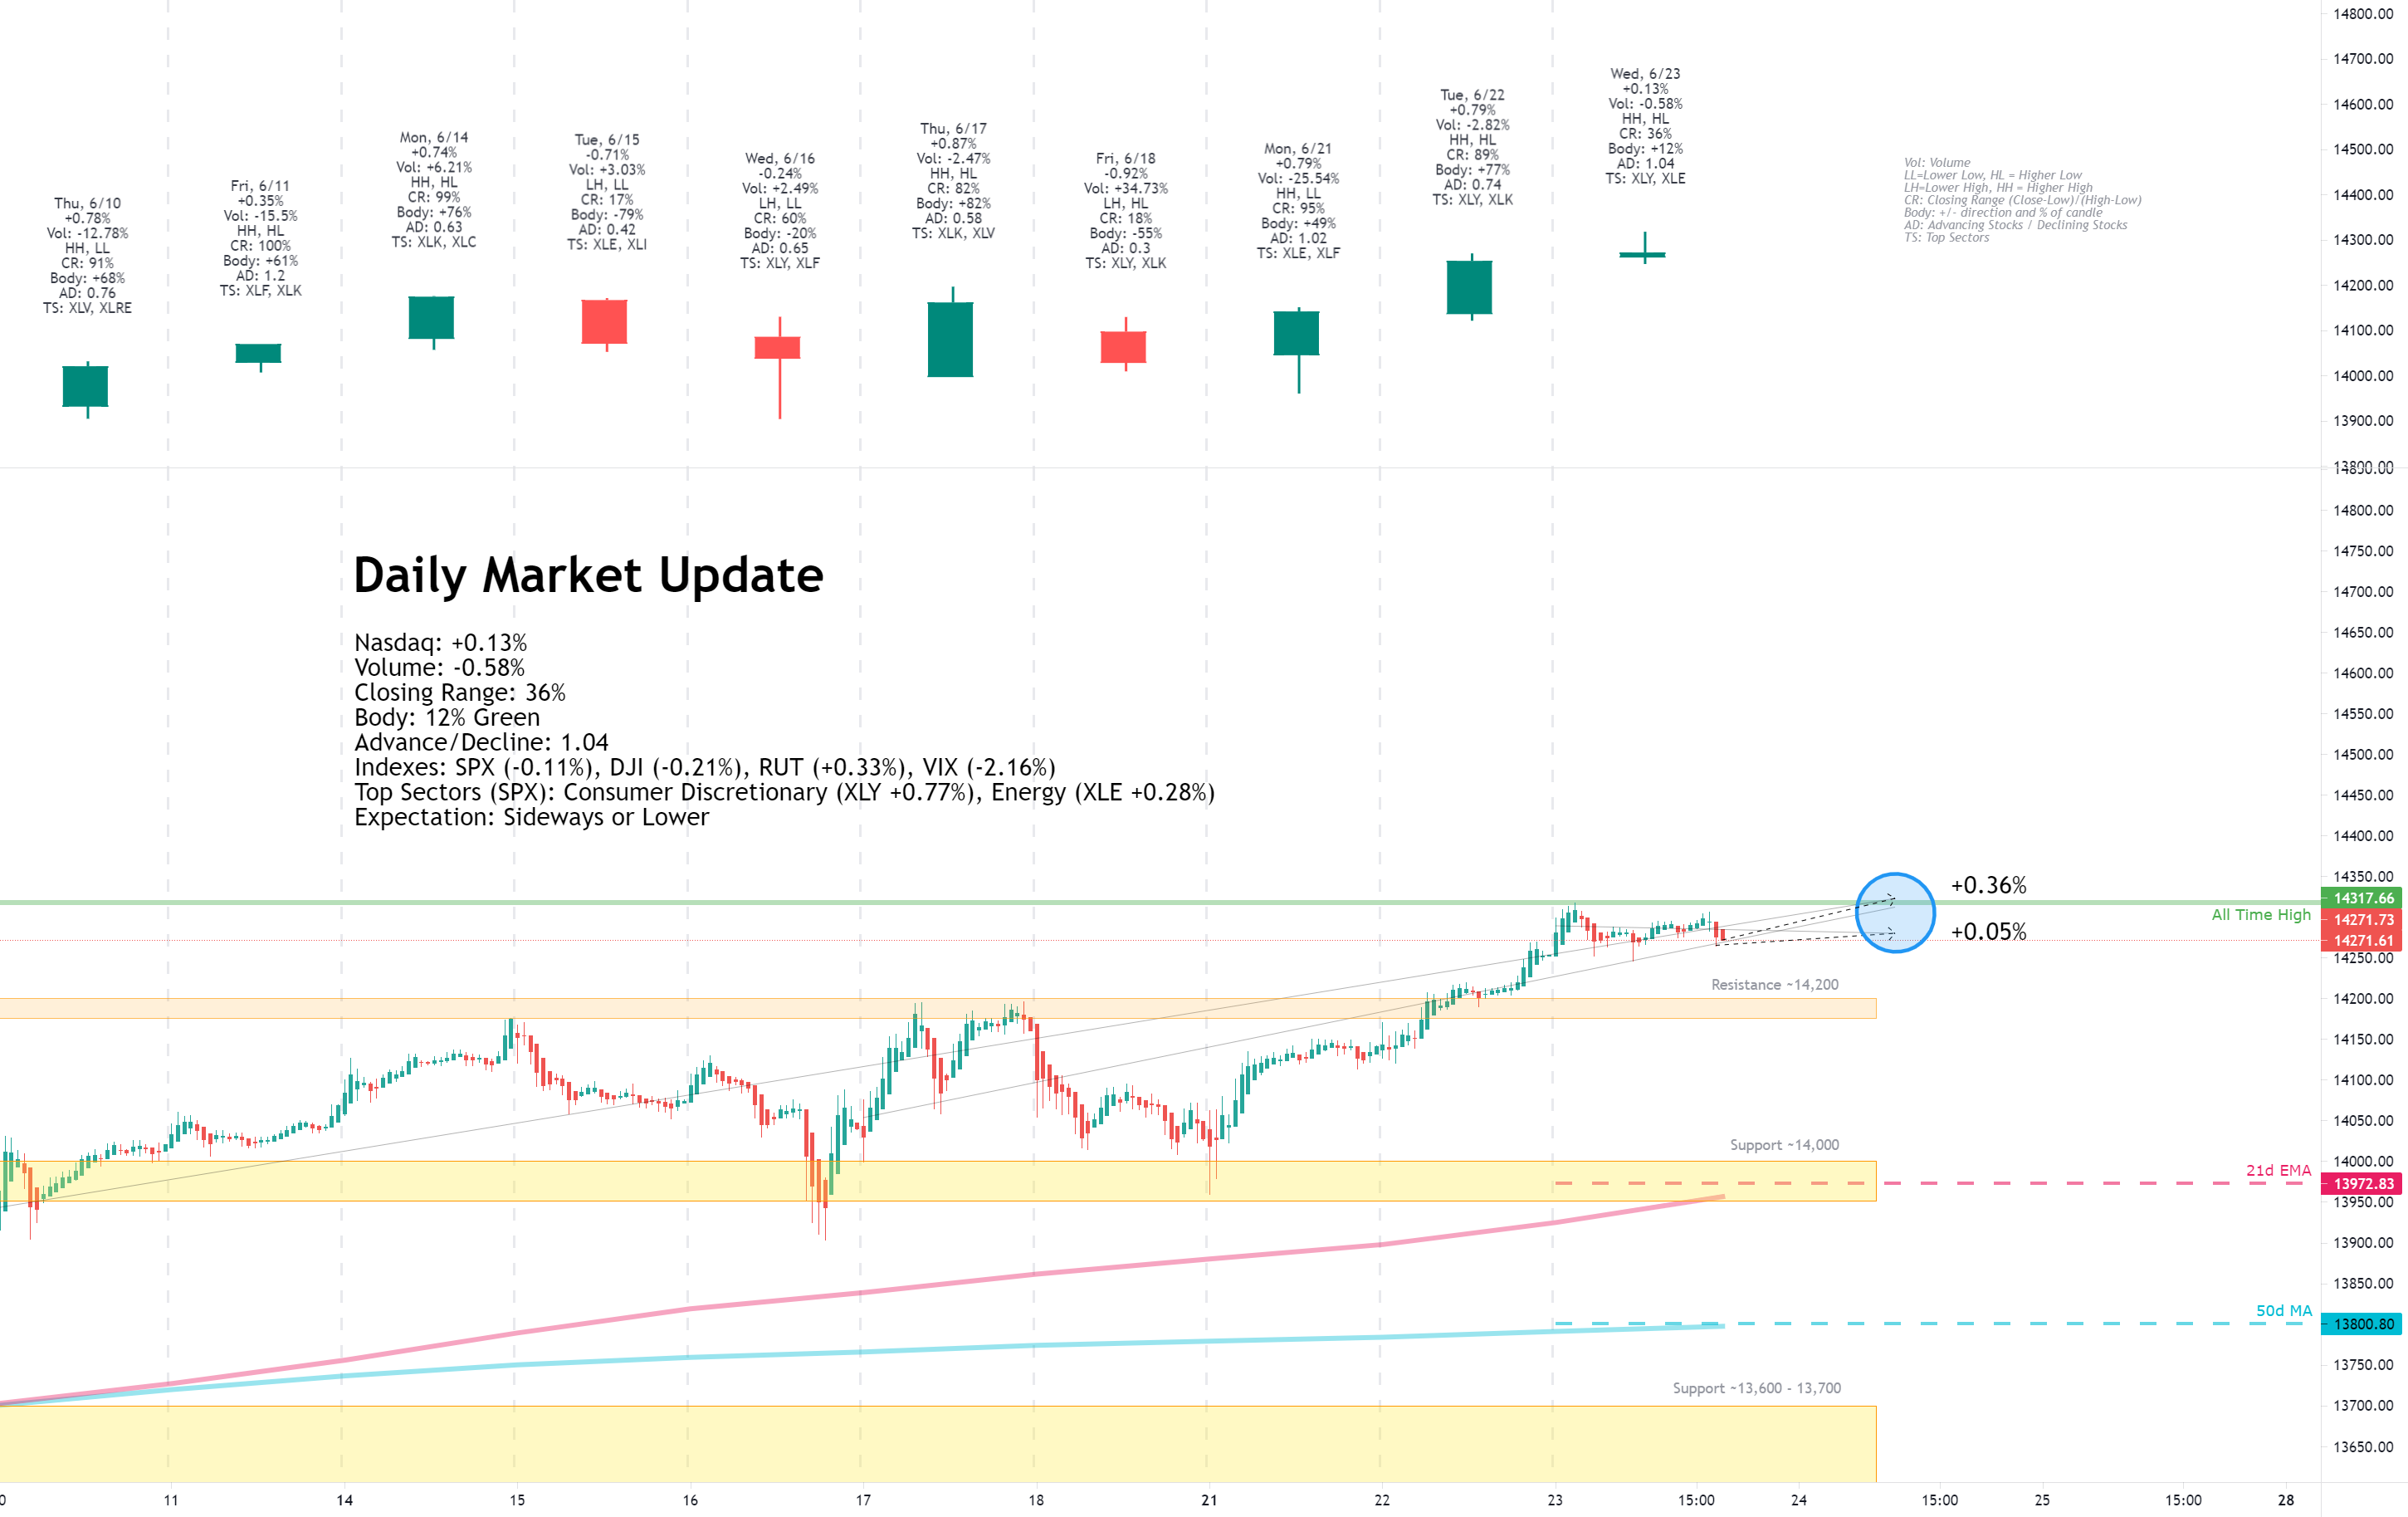
Wednesday, June 23, 2021
Facts: +0.13%, Volume lower, Closing range: 36%, Body: 12%
Good: New high, A/D over 1.0
Bad: Low closing range, weak volume
Highs/Lows: Higher high, higher low
Candle: Thin green body in the lower half of candle
Advanced/Decline: 1.04, About the same number of advancing and declining stocks.
Indexes: SPX (-0.11%), DJI (-0.21%), RUT (+0.33%), VIX (-2.16%)
Sectors: Consumer Discretionary (XLY +0.77%) and Energy (XLE +0.28%) were top. Materials (XLB -0.64%) and Utilities (XLU -1.06%) were bottom.
Expectation: Sideways or Lower
Mixed economic data seemed to bring mixed reactions in the market today. The result is a day of slim gains across the market while the indices pause after a couple of days of gains.
The Nasdaq gained +0.13%. Volume was lower than the previous day. The thin 12% body is in the lower half of the candle, resulting in a 36% closing range. The longer upper wick was formed in a rally just after the market opened, but the index could not hold onto the gains. There were about the same number of advancing stocks as declining stocks.
-=x=-=x=-=x=-=x=-=x=-=x=-=x=-
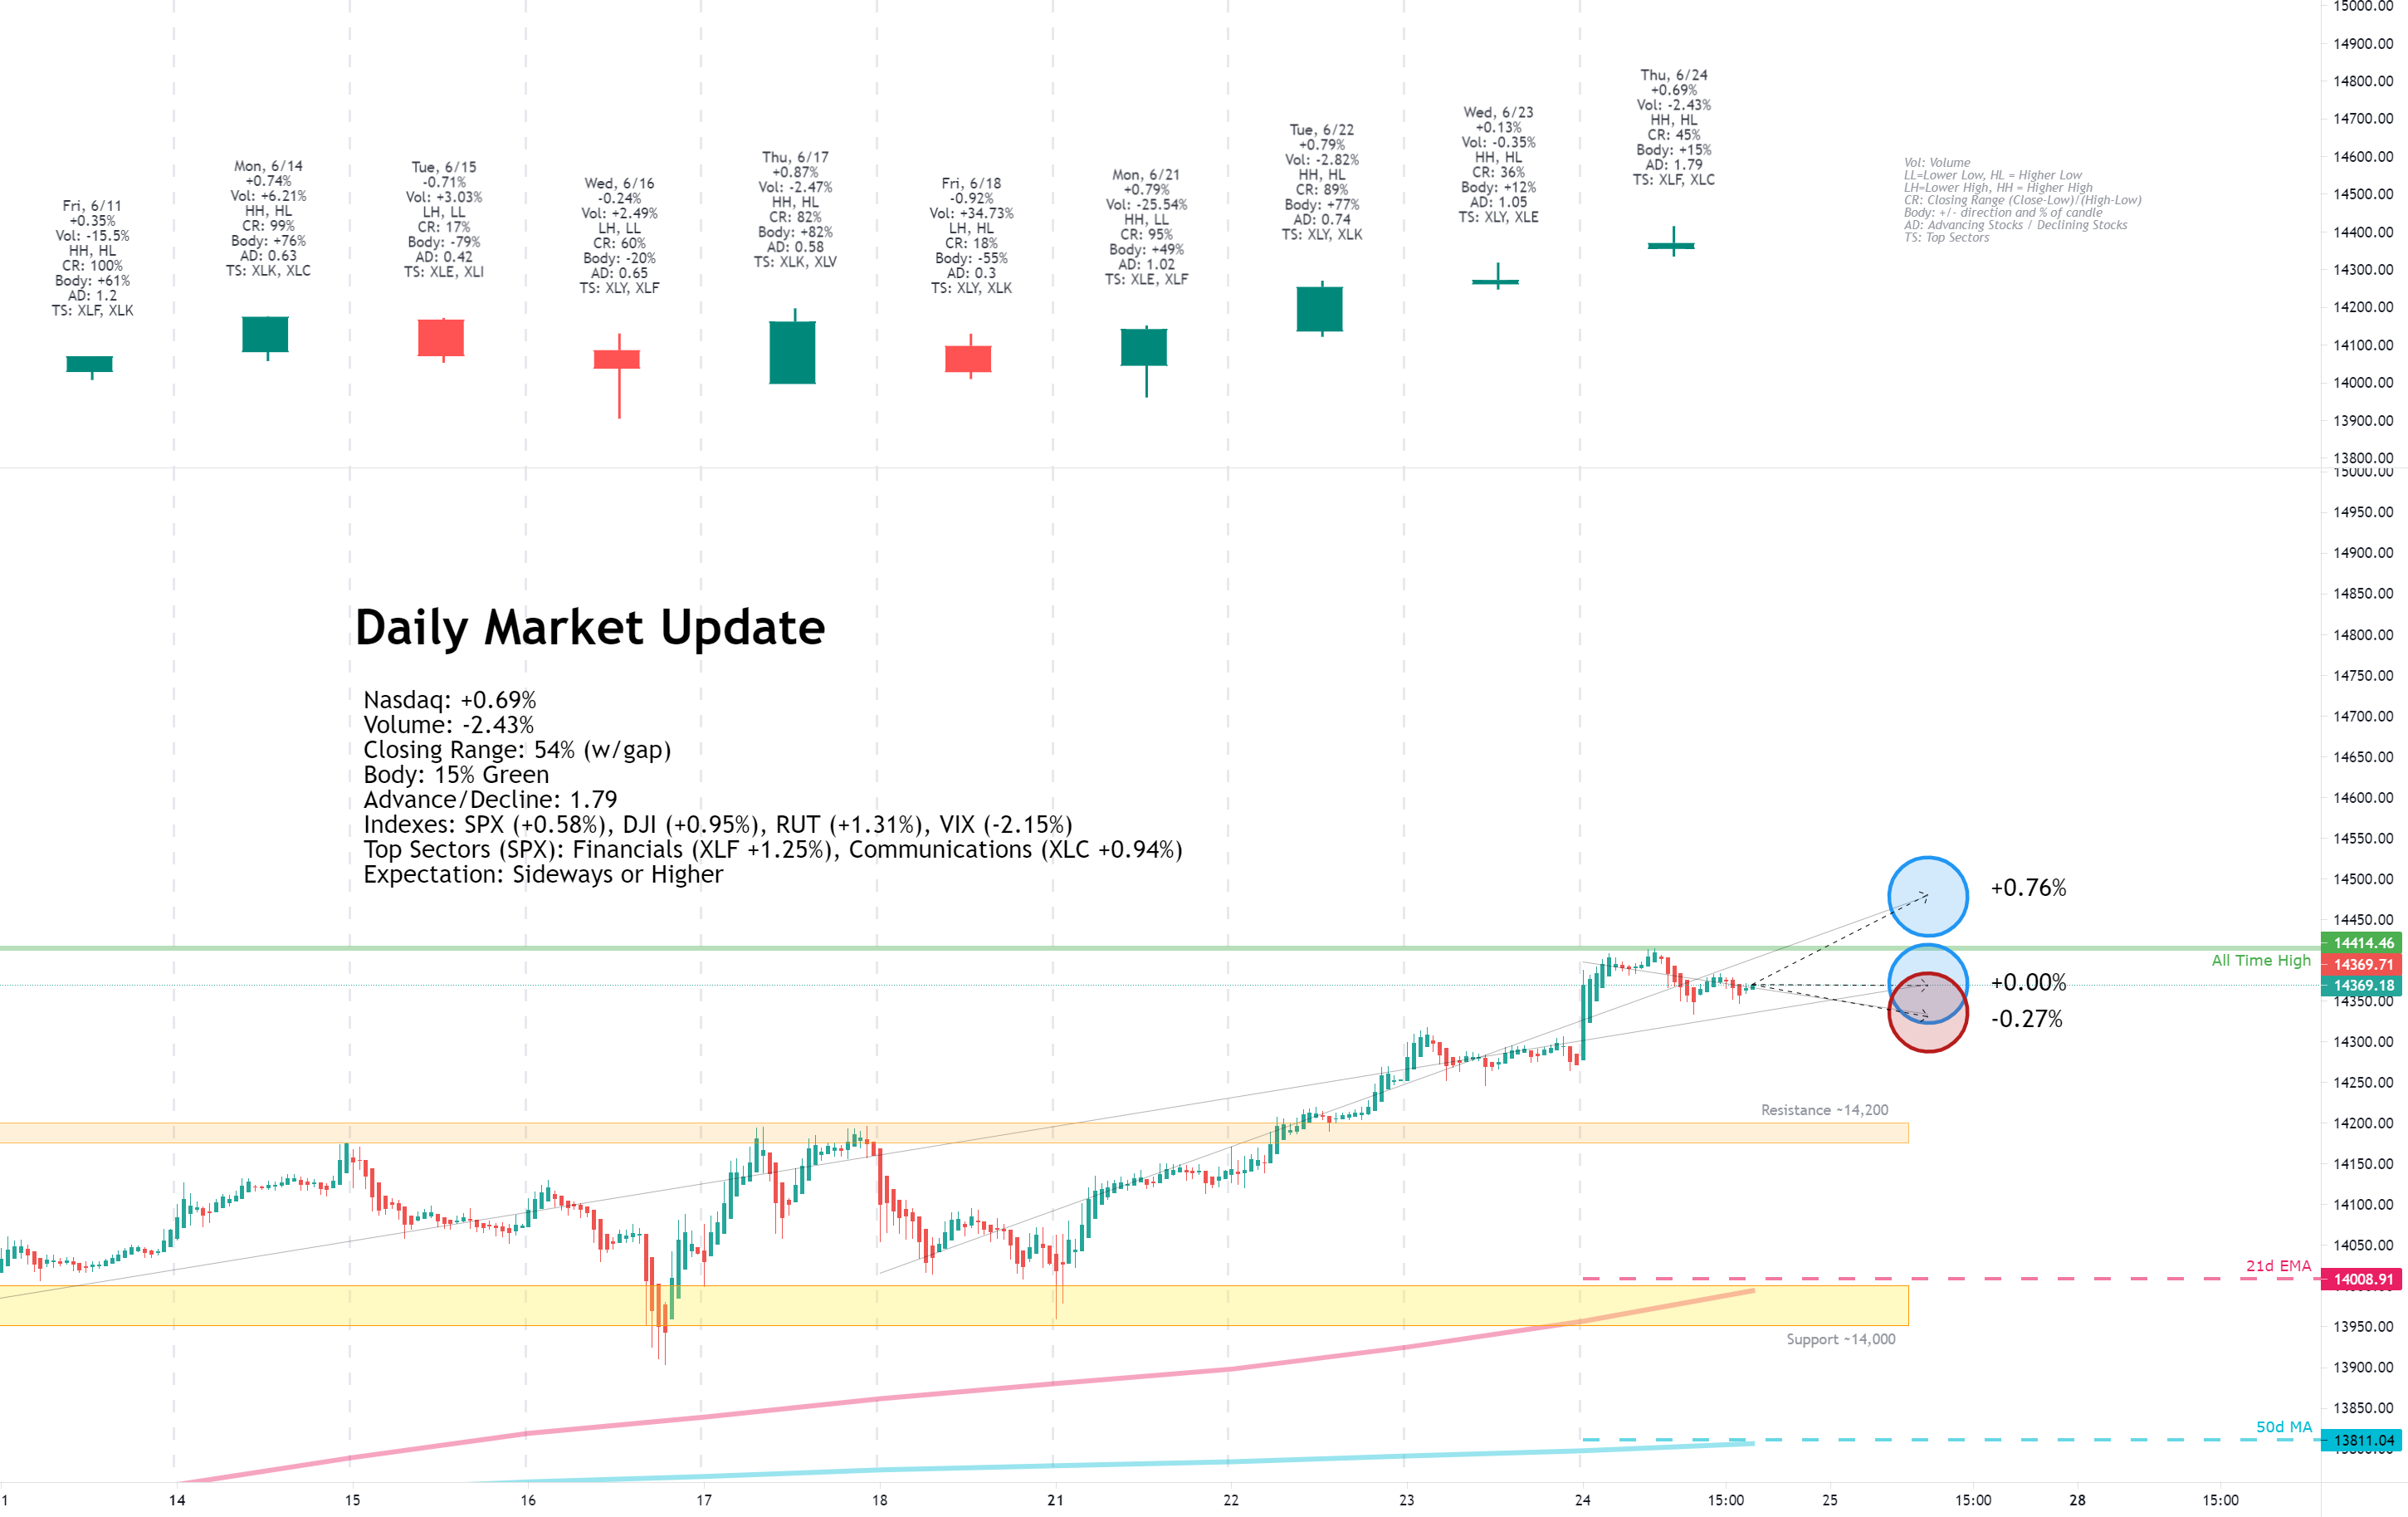
Thursday, June 24, 2021
Facts: +0.69%, Volume lower, Closing range: 54% (w/gap), Body: 15%
Good: Low above yesterday's high creates bullish rising window, high A/D ratio
Bad: Lower volume
Highs/Lows: Higher high, higher low
Candle: Thin green body near middle of candle, gap up at open, longer upper wick
Advanced/Decline: 1.79, Three gaining stocks for every two declining stocks
Indexes: SPX (+0.58%), DJI (+0.95%), RUT (+1.31%), VIX (-2.15%)
Sectors: Financials (XLF +1.25%) and Communications (XLC +0.94%) at top. Utilities (XLU -0.09%) and Real Estate (XLRE -0.47%) at bottom.
Expectation: Sideways or Higher
The S&P 500 and Nasdaq set new record closes today, and gains were broad across sectors and stocks. The Russell 2000 also had gains ahead of the $10 trillion-dollar rebalancing happening this weekend.
The Nasdaq opened the day with a gap-up and ended with a +0.69% gain. Like yesterday, it could not hold an intraday high set mid-day, retreating near the opening price. The 15% green body is under a 54% closing range. The two-day rising window pattern is a bullish continuation pattern. Three stocks advanced for every declining stock.
-=x=-=x=-=x=-=x=-=x=-=x=-=x=-
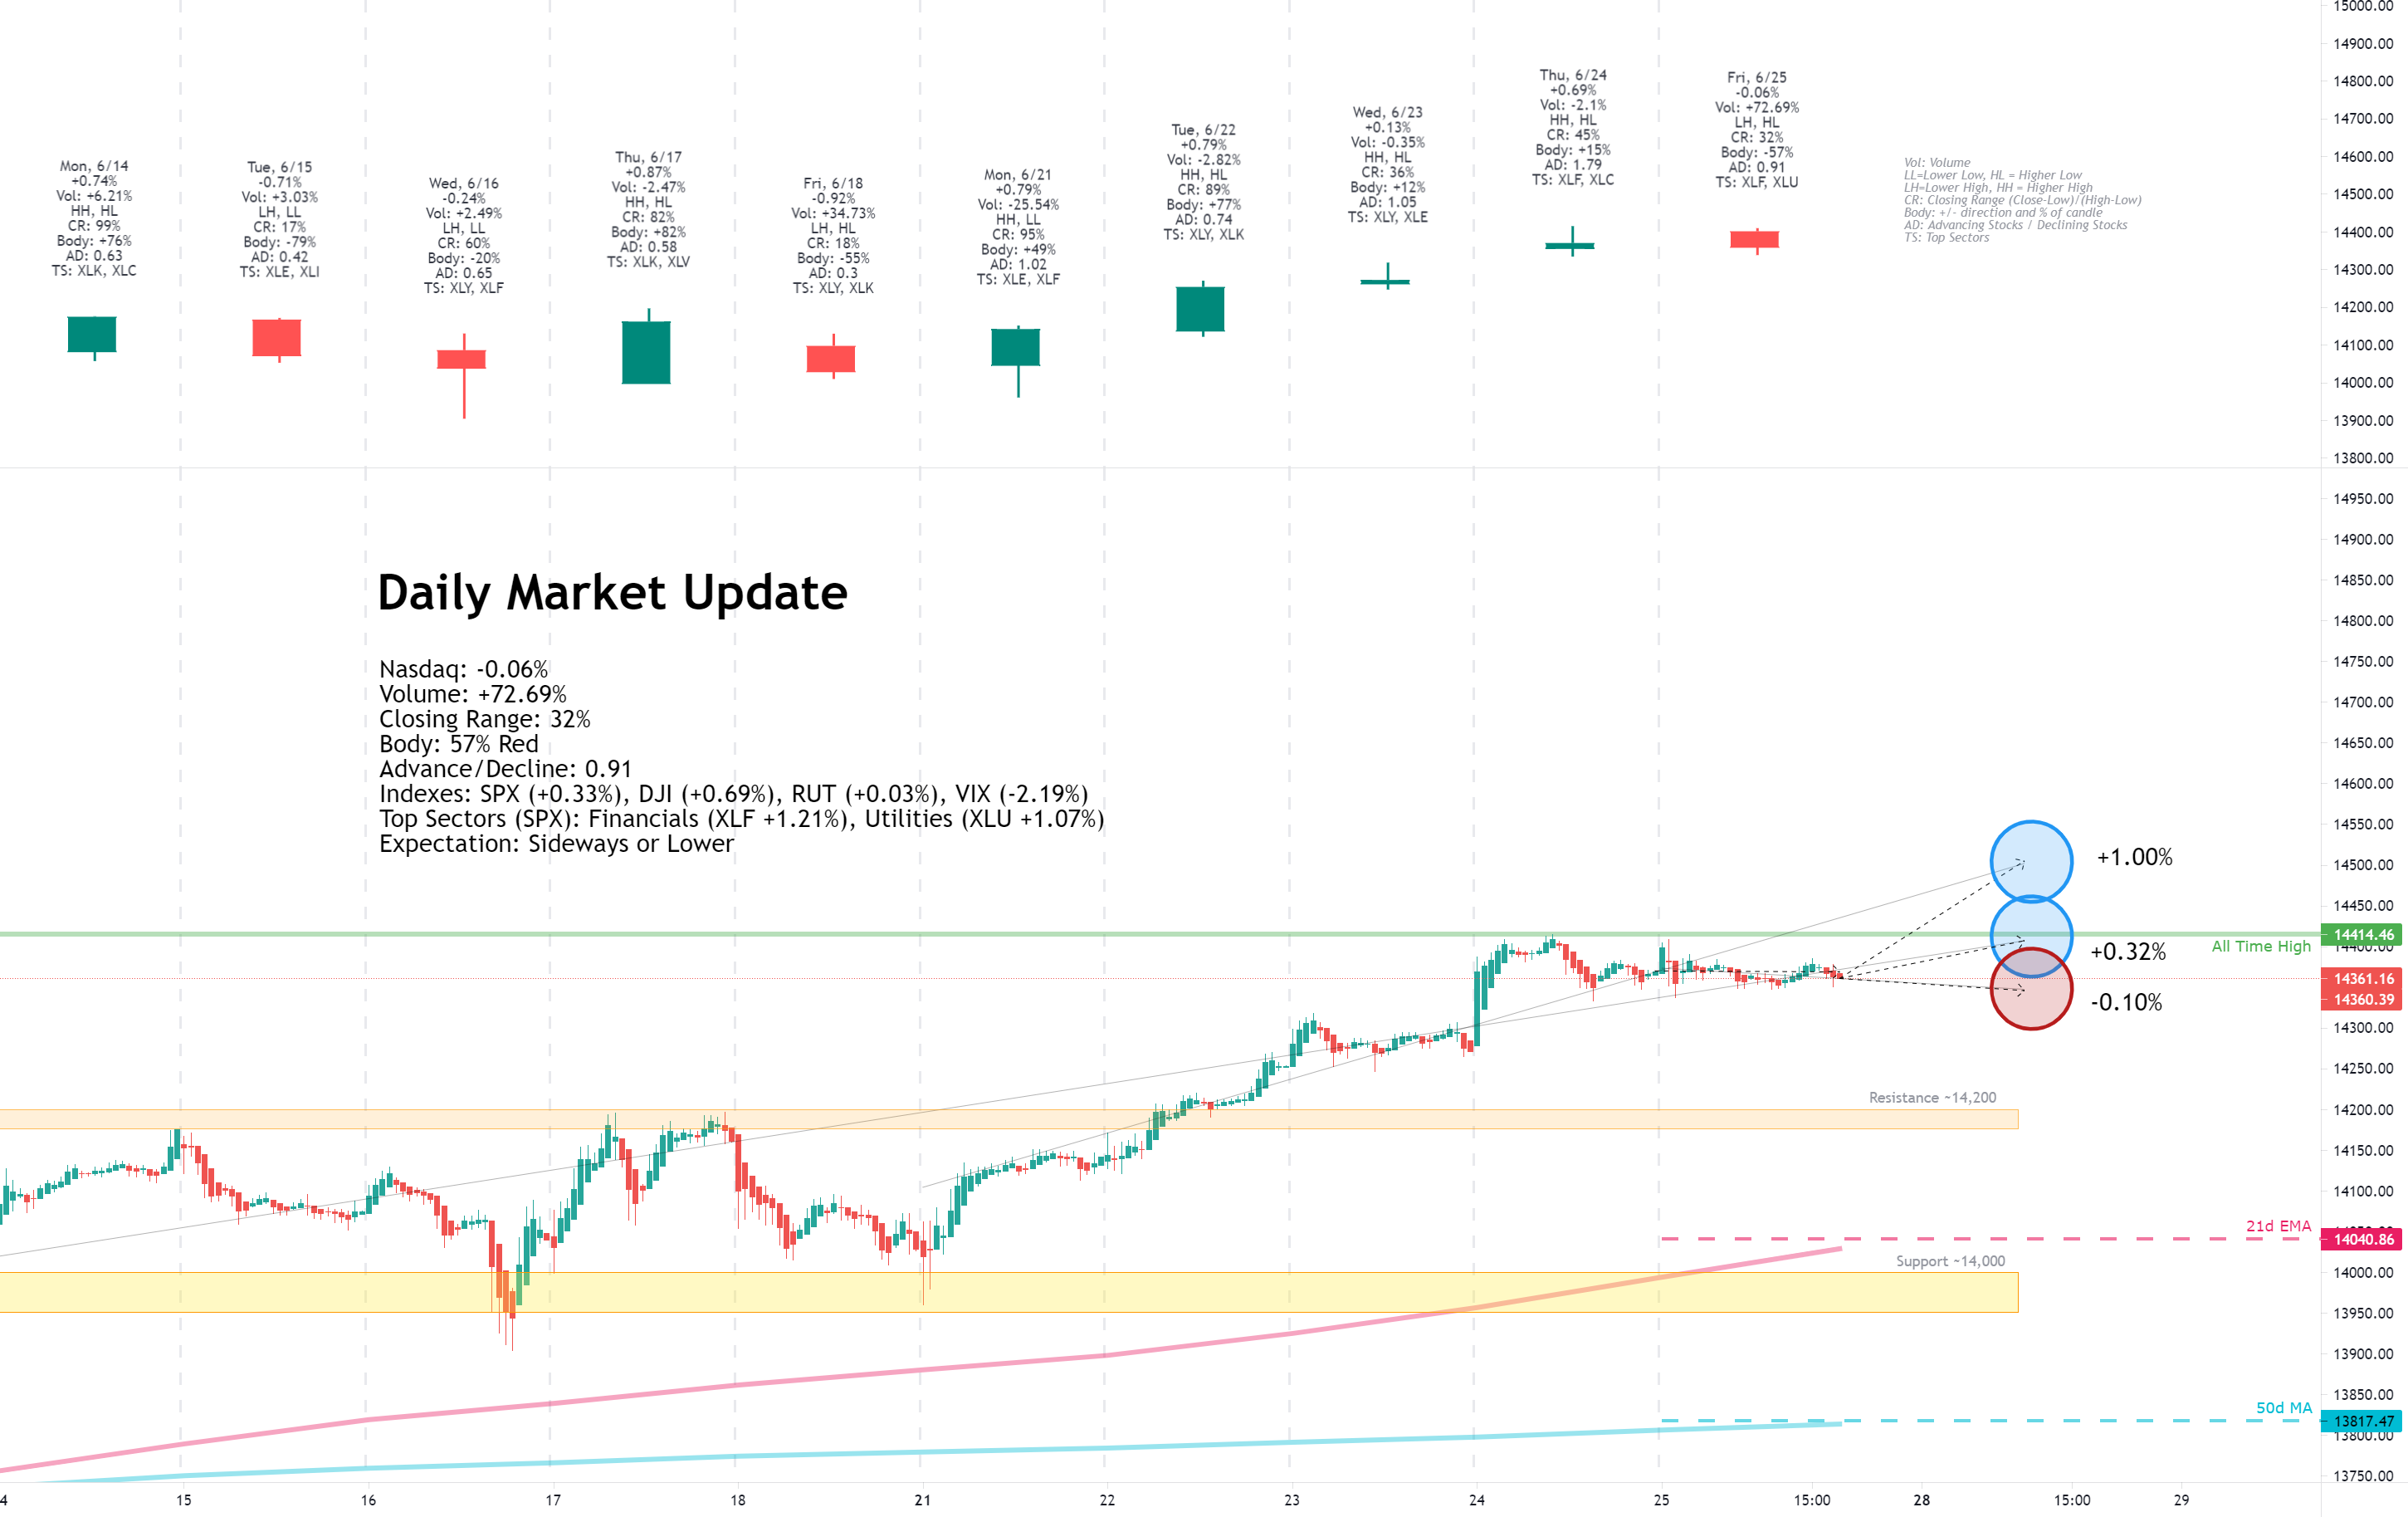
Friday, June 25, 2021
Facts: -0.06%, Volume higher, Closing range: 32%, Body: 57%
Good: Sideways trading with the high/low range of previous day
Bad: Lower high, drop on high volume, thick red body
Highs/Lows: Lower high, higher low
Candle: Inside day, mostly red body with small upper and lower wicks, lower wick is slightly longer
Advanced/Decline: 0.91, more declining stocks than advancing stocks
Indexes: SPX (+0.33%), DJI (+0.69%), RUT (+0.03%), VIX (-2.19%)
Sectors: Financials (XLF +1.21%) and Utilities (XLU +1.07%) at top. Materials (XLB +0.01%) and Technology (XLK -0.12%) were bottom.
Expectation: Sideways or Lower
The S&P 500 closed at another record on Friday while the Nasdaq couldn't make new gains. Economic data is sending mixed signals on the progress of the recovery. For example, while higher than the previous month, consumer data was not as high as analysts expected.
The Nasdaq traded inside the previous day's high and low range and closed lower by the end of the day. The 57y% red body is in the upper part of the candle. The index formed the longer lower wick in morning volatility that set the intraday high and intraday low within the first hour of the trading session. The closing range of 32% is low. The big spike in volume was due to the Russell 3000 rebalancing activity. As a result, there were more declining stocks than advancing stocks.
-=x=-=x=-=x=-=x=-=x=-=x=-=x=-
View on the Week
It was a great week across all major indexes. The week opened with a gain on Monday that erased losses from the prior Friday. Once investors had a chance to absorb the new Fed hawkish stance and get past a quadruple witching day, they were ready to push back into growth stocks and see the markets another step upward.
There were not many surprises throughout the week. Economic news was mixed at times, but nothing was so out of the ordinary to cause investors reactions. Testimony by Jerome Powell to Congress contained no significant changes in posture. His statements reinforced that they believed inflation to be transitory but would be willing to raise interest rates if inflation was higher than expected.
A reconstitution of the Russell 3000 hit the Friday market, where stocks are moved on and off the list based on the current year's capitalization.
The shift causes a rebalance across active and passive indexed funds based on the Russell indexes. That rebalance represented over ten trillion dollars of money moved around stocks on Friday.
The Nasdaq advanced +2.35% this week, setting new record highs. Volume was higher than the previous week due to the rebalancing of indexed funds following the Russell 3000 reconstitution process. The index continued a trend of higher highs and higher lows. The closing range of 88% is excellent. Overall a strong week with a good gain on higher volume.
The Russell 2000 (RUT) had the biggest gain of the major indexes, advancing +4.32% this week and erasing the big loss from the previous week. The Dow Jones Industrial Average (DJI) followed a similar pattern, regaining last week's losses and advancing +3.44% for this week. The S&P 500 (SPX) gained +2.74% and had a weekly record close.
The VIX volatility declined -24.63% for the week.
Energy ( XLE ) and Financials ( XLF ) topped the sector list this week. Energy continues to rise while crude oil prices hit record highs. Financials ( XLF ) is recovering along with yields on Treasury Bonds, which both were hit by the hawkish stance from the Fed last week.
At the bottom of the sector list were the defensive sectors. Utilities ( XLU ) was the only sector to decline this week.
The growth sectors mixed with the cyclical sectors in the middle of the list.
Treasury yields on 30y and 10y rebounded a bit from last week's losses while the US 2y yield remained about the same. As a result, the spread between long-term and short-term yields widened.
The High Yield Corporate Bond (HYG) prices advanced, Investment Grade Bond (LQD) prices declined.
The US Dollar (DXY) declined -0.55% for the week.
Silver (SILVER) advanced +1.16%, and Gold (GOLD) advanced +0.96%.
Crude Oil (CRUDEOIL1!) advanced +3.81%.
Timber (WOOD) advanced +2.66%, the first weekly advance in six weeks.
Copper (COPPER1!) advanced +4.12%.
Aluminum (ALI1!) advanced +4.18%.
-=x=-=x=-=x=-=x=-=x=-=x=-=x=-
Big Four Mega-caps
The big four mega-caps continue to show strength, trading above the 10-week and 40-week moving averages. Apple (AAPL) tested the 10-week line but closed the week with a +2.03% gain. Microsoft (MSFT) gained +2.15%. Alphabet (GOOGL) advanced +2.00%. Amazon (AMZN) was the only loser of the four, falling -2.45% this week after two weeks of significant gains.
-=x=-=x=-=x=-=x=-=x=-=x=-=x=-
The Four Recovery Stocks
I picked four recovery stocks to track against the indexes and other indicators in this weekly report. Exxon Mobile (XOM) gained a huge +7.05%, not only on higher oil prices but also the news that the company will reduce costs by laying off some of its workforce. Marriott (MAR) was the only other gainer, advancing +0.94% but remaining below its 10-week moving average. Delta Airlines (DAL) continues to get resistance at the 10-week line, declining -1.18% this week. Finally, Carnival Cruise Lines (CCL) closed below the 10-week line with a -0.18% loss this week.
-=x=-=x=-=x=-=x=-=x=-=x=-=x=-
Cryptocurrency
I started tracking four major cryptocurrencies on the week in review. The four are Bitcoin, Ethereum, Litecoin, and Bitcoin Cash. The latter two are not the largest by market cap but seem to be well-known and are part of the CIX capital.com index, tracking five cryptocurrencies, including these four (Ripple is the fifth).
The four cryptocurrencies continued to slide lower this week. Bitcoin (BTCUSD) declined -6.70%, closing below its 40-week moving average. Ethereum (ETHUSD) dropped -17.17% but remained above the 40-week line. Both Litecoin (LTCUSD) and Bitcoin Cash (BCHUSD) moved below the 40-week lines with -16.85% and -16.64% losses.
-=x=-=x=-=x=-=x=-=x=-=x=-=x=-
Investor Sentiment
The put/call ratio (PCCE) moved lower, ending the week at 0.567. A contrarian indicator, when the put/call ratio is below 0.7, it signals overly bullish sentiment and could mean an overbought market.
The CNN Fear & Greed Index is on the fear side but moving toward neutral.
The NAAIM money manager exposure index dropped to 70.86 this week.
-=x=-=x=-=x=-=x=-=x=-=x=-=x=-
The Week Ahead
Monday
The Fed member John Williams will speak on Monday morning as the market is opening. The new Russell 3000 list became official after the market close on Friday, and more impact to equities moving on and off the list could occur Monday morning.
There are no relevant earnings reports for the daily update on Monday.
Tuesday
Consumer Confidence numbers for June will be released on Tuesday, after the market open.
There are no relevant earnings reports for the daily update on Tuesday.
Wednesday
Wednesday brings an update on Nonfarm Employment before the market opens. In addition, pending Home Sales and Crude Oil Inventories are available after the market open.
Meme stock, Bed Bath & Beyond (BBBY), will release earnings on Wednesday.
Thursday
Thursday's economic data includes Initial Jobless Claims and Manufacturing Purchasing Managers Index.
Walgreens Boots (WBA) releases earnings on Thursday.
Friday
More economic data becomes available on Friday. Average Hourly Earnings, Nonfarm Payrolls, and the Unemployment Rate will provide insights into the labor market recovery. Trade Balance data will also be released.
There are no relevant earnings reports for the daily update on Friday.
-=x=-=x=-=x=-=x=-=x=-=x=-=x=-
The Bullish Side
The Nasdaq continues in a Power Trend while the other major indices are making advances. Power Trends are times to be very bullish on stocks. Investor's Business Daily has information on how to spot Power Trends.
There doesn't seem to be any considerable catalyst coming this week unless there are surprises in economic data. The lack of a catalyst should keep investor sentiment in the positive and help further advance the market.
The US Dollar is holding up at its current level. Long-term Treasury yields are recovering a bit while short-term yields continue to remain high. The yield gap remains tighter than it was earlier in the year.
It seems the four 2021 fears (Retail Investors, Bonds Volatility, Inflation, and Interest Rates) are all under control for the moment.
-=x=-=x=-=x=-=x=-=x=-=x=-=x=-
The Bearish Side
After a big week of gains into record closes, it would not be a huge surprise to have the market pullback or pause here. However, a few surprises in the economic calendar would turn the markets more bearish.
First, anytime the Fed speaks, the market will be watching closely. Fed John Williams will be making remarks at the BIS Andrew Crockett Memorial Lecture on Monday morning.
Investors will also be watching Employment data throughout the week. The data starts on Wednesday with the ADP Nonfarm Employment Data, continues on Thursday with Initial Jobless Claims, and ends with the Unemployment Rate and Payrolls data. The ideal situation is that the data comes in near expected, not too low or too high. Significant differences in either direction could bring volatility back to the US dollar and bonds and have a negative impact on equities.
It's a light week on economic news and earnings. There's not much to be bearish about in the data. But many times, it is when you don't expect them that the bears come out of nowhere.
-=x=-=x=-=x=-=x=-=x=-=x=-=x=-
Key Nasdaq Levels to Watch
The Nasdaq found support at 14,000 last week and moved higher this week, closing at new all-time highs.
On the positive side, the levels are:
On the downside, there are a few key levels:
-=x=-=x=-=x=-=x=-=x=-=x=-=x=-
Wrap-up
If you read last week's review, we learned some important things about investor sentiment in the current market. Out-of-control inflation is the greater evil than higher interest rates. Once investors absorbed the Fed's comments, they showed confidence that the Fed recognizes inflation and is willing to control it with higher interest rates. Yet, the Fed is not rushing to raise those rates unless inflation fears become a reality, comforting the long-term investor.
That allowed the market to move a leg up this week. From last week's pivot, nothing changed, and there is not much coming next week that would cause a sentiment change, so I expect sideways or higher for the coming week. Let's watch and see what happens.
Good luck, stay healthy, and trade safe!
Notes
- The Market Week in Review is my weekend homework where I look over what happened in the previous week and what might come in the next week.
- I occasionally have some errors or typos and will correct them in my blog or the comments on TradingView. I do not have an editor and do this in my free time.
- If you find this helpful, please let me know in the comments. I am also more than happy to add new perspectives and data points if you have ideas.
The structure is the following:
- A recap of the daily updates that I do here on TradingView.
- View on the past week
- What's coming in the next week
- The Bullish View, The Bearish View
- Key index levels to watch out for
- Wrap-up
If you have been following my daily updates, you can skip down to "View on the Week." If not, then this first part is a great play-by-play recap for the week. Click the daily charts for more detail on sectors, indexes, and market leaders each day.
-=x=-=x=-=x=-=x=-=x=-=x=-=x=-
Monday, June 21, 2021
Facts: +0.79%, Volume higher, Closing range: 95%, Body: 49%
Good: Higher high, long lower wick from bullish rebound off morning low
Bad: Lower low, otherwise not much
Highs/Lows: Higher high, lower low
Candle: Half green body with long lower wick, small upper wick
Advanced/Decline: 1.03, One advancing stock for each declining stock
Indexes: SPX (+1.40%), DJI (+1.76%), RUT (+2.16%), VIX (-13.66%)
Sectors: Energy (XLE +3.21%) and Financials (XLF +1.93%) were top. Utilities (XLU +0.51%) and Consumer Staples (XLP +0.49%) were bottom.
Expectation: Sideways or Higher
Investors moved back into equities on Monday, helping markets rebound from Friday's sell-off. All major indexes and sectors moved higher while stocks ended the day balanced across gains and losses.
The Nasdaq closed with a +0.79% gain. The volume was lower than Friday's unusually high volume. The 49% body is in the upper half of the candle, above a long lower wick formed just after the market open. The index dropped after open, but found support around 14,000 and moved higher the rest of the day. There were about the same number of advancing stocks as declining stocks.
-=x=-=x=-=x=-=x=-=x=-=x=-=x=-
Tuesday, June 22, 2021
Facts: +0.79%, Volume lower, Closing range: 89%, Body: 77%
Good: New all-time high, thick green body, small wicks
Bad: A/D ratio, lower volume
Highs/Lows: Higher high, higher low
Candle: Mostly green body with short upper and lower wicks
Advanced/Decline: 0.74, More declining stocks than advancing stocks
Indexes: SPX (+0.51%), DJI (+0.20%), RUT (+0.43%), VIX (-6.77%)
Sectors: Consumer Discretionary (XLY +0.94%) and Technology (XLK +0.91%) were top. Real Estate (XLRE -0.45%) and Utilities (XLU -0.61%) were bottom.
Expectation: Higher
It was a record-setting day for the Nasdaq, setting a new all-time high for the first time since April. The other major indexes also had good gains for the day, while the sector list mainly was positive. Investors responded to better than expected existing home sales data and no new surprises from Fed Jerome Powell's testimony to congress.
The Nasdaq gained +0.79% for the day and finished the day with its highest close since April. The closing range of 89% and 77% green body represents a bullish session that only paused mid-day to await Powell's comments. Despite the bullish day, there were more declining stocks than advancing stocks.
-=x=-=x=-=x=-=x=-=x=-=x=-=x=-
Wednesday, June 23, 2021
Facts: +0.13%, Volume lower, Closing range: 36%, Body: 12%
Good: New high, A/D over 1.0
Bad: Low closing range, weak volume
Highs/Lows: Higher high, higher low
Candle: Thin green body in the lower half of candle
Advanced/Decline: 1.04, About the same number of advancing and declining stocks.
Indexes: SPX (-0.11%), DJI (-0.21%), RUT (+0.33%), VIX (-2.16%)
Sectors: Consumer Discretionary (XLY +0.77%) and Energy (XLE +0.28%) were top. Materials (XLB -0.64%) and Utilities (XLU -1.06%) were bottom.
Expectation: Sideways or Lower
Mixed economic data seemed to bring mixed reactions in the market today. The result is a day of slim gains across the market while the indices pause after a couple of days of gains.
The Nasdaq gained +0.13%. Volume was lower than the previous day. The thin 12% body is in the lower half of the candle, resulting in a 36% closing range. The longer upper wick was formed in a rally just after the market opened, but the index could not hold onto the gains. There were about the same number of advancing stocks as declining stocks.
-=x=-=x=-=x=-=x=-=x=-=x=-=x=-
Thursday, June 24, 2021
Facts: +0.69%, Volume lower, Closing range: 54% (w/gap), Body: 15%
Good: Low above yesterday's high creates bullish rising window, high A/D ratio
Bad: Lower volume
Highs/Lows: Higher high, higher low
Candle: Thin green body near middle of candle, gap up at open, longer upper wick
Advanced/Decline: 1.79, Three gaining stocks for every two declining stocks
Indexes: SPX (+0.58%), DJI (+0.95%), RUT (+1.31%), VIX (-2.15%)
Sectors: Financials (XLF +1.25%) and Communications (XLC +0.94%) at top. Utilities (XLU -0.09%) and Real Estate (XLRE -0.47%) at bottom.
Expectation: Sideways or Higher
The S&P 500 and Nasdaq set new record closes today, and gains were broad across sectors and stocks. The Russell 2000 also had gains ahead of the $10 trillion-dollar rebalancing happening this weekend.
The Nasdaq opened the day with a gap-up and ended with a +0.69% gain. Like yesterday, it could not hold an intraday high set mid-day, retreating near the opening price. The 15% green body is under a 54% closing range. The two-day rising window pattern is a bullish continuation pattern. Three stocks advanced for every declining stock.
-=x=-=x=-=x=-=x=-=x=-=x=-=x=-
Friday, June 25, 2021
Facts: -0.06%, Volume higher, Closing range: 32%, Body: 57%
Good: Sideways trading with the high/low range of previous day
Bad: Lower high, drop on high volume, thick red body
Highs/Lows: Lower high, higher low
Candle: Inside day, mostly red body with small upper and lower wicks, lower wick is slightly longer
Advanced/Decline: 0.91, more declining stocks than advancing stocks
Indexes: SPX (+0.33%), DJI (+0.69%), RUT (+0.03%), VIX (-2.19%)
Sectors: Financials (XLF +1.21%) and Utilities (XLU +1.07%) at top. Materials (XLB +0.01%) and Technology (XLK -0.12%) were bottom.
Expectation: Sideways or Lower
The S&P 500 closed at another record on Friday while the Nasdaq couldn't make new gains. Economic data is sending mixed signals on the progress of the recovery. For example, while higher than the previous month, consumer data was not as high as analysts expected.
The Nasdaq traded inside the previous day's high and low range and closed lower by the end of the day. The 57y% red body is in the upper part of the candle. The index formed the longer lower wick in morning volatility that set the intraday high and intraday low within the first hour of the trading session. The closing range of 32% is low. The big spike in volume was due to the Russell 3000 rebalancing activity. As a result, there were more declining stocks than advancing stocks.
-=x=-=x=-=x=-=x=-=x=-=x=-=x=-
View on the Week
It was a great week across all major indexes. The week opened with a gain on Monday that erased losses from the prior Friday. Once investors had a chance to absorb the new Fed hawkish stance and get past a quadruple witching day, they were ready to push back into growth stocks and see the markets another step upward.
There were not many surprises throughout the week. Economic news was mixed at times, but nothing was so out of the ordinary to cause investors reactions. Testimony by Jerome Powell to Congress contained no significant changes in posture. His statements reinforced that they believed inflation to be transitory but would be willing to raise interest rates if inflation was higher than expected.
A reconstitution of the Russell 3000 hit the Friday market, where stocks are moved on and off the list based on the current year's capitalization.
The shift causes a rebalance across active and passive indexed funds based on the Russell indexes. That rebalance represented over ten trillion dollars of money moved around stocks on Friday.
The Nasdaq advanced +2.35% this week, setting new record highs. Volume was higher than the previous week due to the rebalancing of indexed funds following the Russell 3000 reconstitution process. The index continued a trend of higher highs and higher lows. The closing range of 88% is excellent. Overall a strong week with a good gain on higher volume.
The Russell 2000 (RUT) had the biggest gain of the major indexes, advancing +4.32% this week and erasing the big loss from the previous week. The Dow Jones Industrial Average (DJI) followed a similar pattern, regaining last week's losses and advancing +3.44% for this week. The S&P 500 (SPX) gained +2.74% and had a weekly record close.
The VIX volatility declined -24.63% for the week.

Energy ( XLE ) and Financials ( XLF ) topped the sector list this week. Energy continues to rise while crude oil prices hit record highs. Financials ( XLF ) is recovering along with yields on Treasury Bonds, which both were hit by the hawkish stance from the Fed last week.
At the bottom of the sector list were the defensive sectors. Utilities ( XLU ) was the only sector to decline this week.
The growth sectors mixed with the cyclical sectors in the middle of the list.
Treasury yields on 30y and 10y rebounded a bit from last week's losses while the US 2y yield remained about the same. As a result, the spread between long-term and short-term yields widened.
The High Yield Corporate Bond (HYG) prices advanced, Investment Grade Bond (LQD) prices declined.
The US Dollar (DXY) declined -0.55% for the week.
Silver (SILVER) advanced +1.16%, and Gold (GOLD) advanced +0.96%.
Crude Oil (CRUDEOIL1!) advanced +3.81%.
Timber (WOOD) advanced +2.66%, the first weekly advance in six weeks.
Copper (COPPER1!) advanced +4.12%.
Aluminum (ALI1!) advanced +4.18%.
-=x=-=x=-=x=-=x=-=x=-=x=-=x=-
Big Four Mega-caps
The big four mega-caps continue to show strength, trading above the 10-week and 40-week moving averages. Apple (AAPL) tested the 10-week line but closed the week with a +2.03% gain. Microsoft (MSFT) gained +2.15%. Alphabet (GOOGL) advanced +2.00%. Amazon (AMZN) was the only loser of the four, falling -2.45% this week after two weeks of significant gains.
-=x=-=x=-=x=-=x=-=x=-=x=-=x=-
The Four Recovery Stocks
I picked four recovery stocks to track against the indexes and other indicators in this weekly report. Exxon Mobile (XOM) gained a huge +7.05%, not only on higher oil prices but also the news that the company will reduce costs by laying off some of its workforce. Marriott (MAR) was the only other gainer, advancing +0.94% but remaining below its 10-week moving average. Delta Airlines (DAL) continues to get resistance at the 10-week line, declining -1.18% this week. Finally, Carnival Cruise Lines (CCL) closed below the 10-week line with a -0.18% loss this week.
-=x=-=x=-=x=-=x=-=x=-=x=-=x=-
Cryptocurrency
I started tracking four major cryptocurrencies on the week in review. The four are Bitcoin, Ethereum, Litecoin, and Bitcoin Cash. The latter two are not the largest by market cap but seem to be well-known and are part of the CIX capital.com index, tracking five cryptocurrencies, including these four (Ripple is the fifth).
The four cryptocurrencies continued to slide lower this week. Bitcoin (BTCUSD) declined -6.70%, closing below its 40-week moving average. Ethereum (ETHUSD) dropped -17.17% but remained above the 40-week line. Both Litecoin (LTCUSD) and Bitcoin Cash (BCHUSD) moved below the 40-week lines with -16.85% and -16.64% losses.
-=x=-=x=-=x=-=x=-=x=-=x=-=x=-
Investor Sentiment
The put/call ratio (PCCE) moved lower, ending the week at 0.567. A contrarian indicator, when the put/call ratio is below 0.7, it signals overly bullish sentiment and could mean an overbought market.
The CNN Fear & Greed Index is on the fear side but moving toward neutral.
The NAAIM money manager exposure index dropped to 70.86 this week.
-=x=-=x=-=x=-=x=-=x=-=x=-=x=-
The Week Ahead
Monday
The Fed member John Williams will speak on Monday morning as the market is opening. The new Russell 3000 list became official after the market close on Friday, and more impact to equities moving on and off the list could occur Monday morning.
There are no relevant earnings reports for the daily update on Monday.
Tuesday
Consumer Confidence numbers for June will be released on Tuesday, after the market open.
There are no relevant earnings reports for the daily update on Tuesday.
Wednesday
Wednesday brings an update on Nonfarm Employment before the market opens. In addition, pending Home Sales and Crude Oil Inventories are available after the market open.
Meme stock, Bed Bath & Beyond (BBBY), will release earnings on Wednesday.
Thursday
Thursday's economic data includes Initial Jobless Claims and Manufacturing Purchasing Managers Index.
Walgreens Boots (WBA) releases earnings on Thursday.
Friday
More economic data becomes available on Friday. Average Hourly Earnings, Nonfarm Payrolls, and the Unemployment Rate will provide insights into the labor market recovery. Trade Balance data will also be released.
There are no relevant earnings reports for the daily update on Friday.
-=x=-=x=-=x=-=x=-=x=-=x=-=x=-
The Bullish Side
The Nasdaq continues in a Power Trend while the other major indices are making advances. Power Trends are times to be very bullish on stocks. Investor's Business Daily has information on how to spot Power Trends.
There doesn't seem to be any considerable catalyst coming this week unless there are surprises in economic data. The lack of a catalyst should keep investor sentiment in the positive and help further advance the market.
The US Dollar is holding up at its current level. Long-term Treasury yields are recovering a bit while short-term yields continue to remain high. The yield gap remains tighter than it was earlier in the year.
It seems the four 2021 fears (Retail Investors, Bonds Volatility, Inflation, and Interest Rates) are all under control for the moment.
-=x=-=x=-=x=-=x=-=x=-=x=-=x=-
The Bearish Side
After a big week of gains into record closes, it would not be a huge surprise to have the market pullback or pause here. However, a few surprises in the economic calendar would turn the markets more bearish.
First, anytime the Fed speaks, the market will be watching closely. Fed John Williams will be making remarks at the BIS Andrew Crockett Memorial Lecture on Monday morning.
Investors will also be watching Employment data throughout the week. The data starts on Wednesday with the ADP Nonfarm Employment Data, continues on Thursday with Initial Jobless Claims, and ends with the Unemployment Rate and Payrolls data. The ideal situation is that the data comes in near expected, not too low or too high. Significant differences in either direction could bring volatility back to the US dollar and bonds and have a negative impact on equities.
It's a light week on economic news and earnings. There's not much to be bearish about in the data. But many times, it is when you don't expect them that the bears come out of nowhere.
-=x=-=x=-=x=-=x=-=x=-=x=-=x=-
Key Nasdaq Levels to Watch
The Nasdaq found support at 14,000 last week and moved higher this week, closing at new all-time highs.
On the positive side, the levels are:
- The high of this past week was a new all-time high at 14,414.46.
- The mid-point of the regression trend from the 5/12 low points to 14,556 by the end of the week.
On the downside, there are a few key levels:
- The 10d MA is at 14,187.50.
- 14,000 has been a key area of support/resistance.
- The low of this past week is 13,960.04.
- The 21d EMA is at 14040.86.
- The 50d MA is at 13,782.40817.47.
- There is a pivot at 13,548.93. This is a "higher low" in the current uptrend.
- There is a support area at 13,000. 13,002.54 is a pivot from May. Below this level is a correction.
- 12862.73 is the 200d MA. This could be a support point if the index falls below 13,000.
- 12,397.05 is a low pivot point from the early March dip.
-=x=-=x=-=x=-=x=-=x=-=x=-=x=-
Wrap-up
If you read last week's review, we learned some important things about investor sentiment in the current market. Out-of-control inflation is the greater evil than higher interest rates. Once investors absorbed the Fed's comments, they showed confidence that the Fed recognizes inflation and is willing to control it with higher interest rates. Yet, the Fed is not rushing to raise those rates unless inflation fears become a reality, comforting the long-term investor.
That allowed the market to move a leg up this week. From last week's pivot, nothing changed, and there is not much coming next week that would cause a sentiment change, so I expect sideways or higher for the coming week. Let's watch and see what happens.
Good luck, stay healthy, and trade safe!