
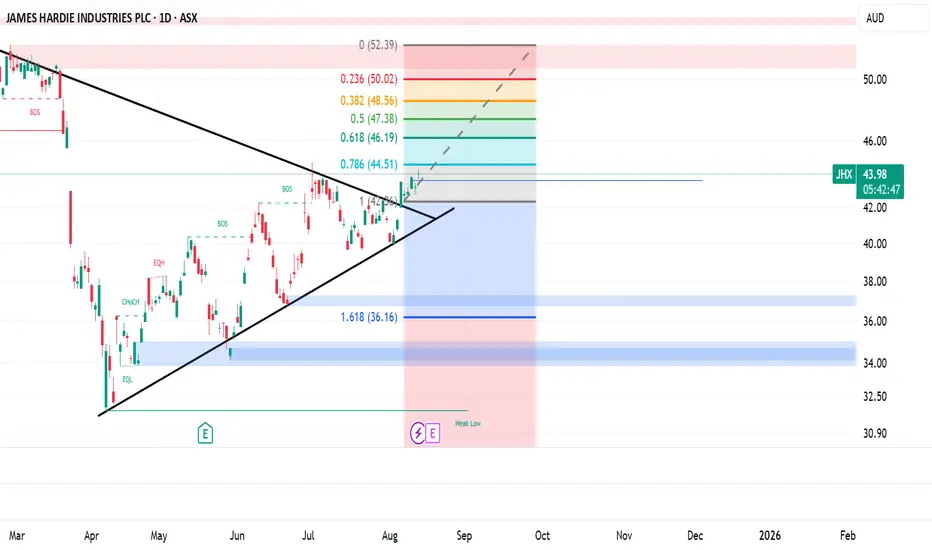
The chart shows James Hardie Industries (ASX: JHX) breaking out of a symmetrical triangle pattern after a period of consolidation.
- Breakout confirmation: Price has moved above the upper trendline with increasing momentum, signalling potential bullish continuation.
- Fibonacci targets: Initial resistance levels are at 46.19 (Fib 0.618), 47.38 (Fib 0.5), and 48.56 (Fib 0.382). The major resistance sits near 50.02 before the prior high at 52.39.
- Upside potential: If the breakout holds, the measured move from the triangle suggests a climb towards the mid–high 40s in the short term, with a possible retest of the all-time high in the coming months.
- Risk level: A drop back below ~42.95 would invalidate the breakout and risk a move towards the 36.16 Fib extension support.

Disclaimer
The information and publications are not meant to be, and do not constitute, financial, investment, trading, or other types of advice or recommendations supplied or endorsed by TradingView. Read more in the Terms of Use.
Disclaimer
The information and publications are not meant to be, and do not constitute, financial, investment, trading, or other types of advice or recommendations supplied or endorsed by TradingView. Read more in the Terms of Use.