✅
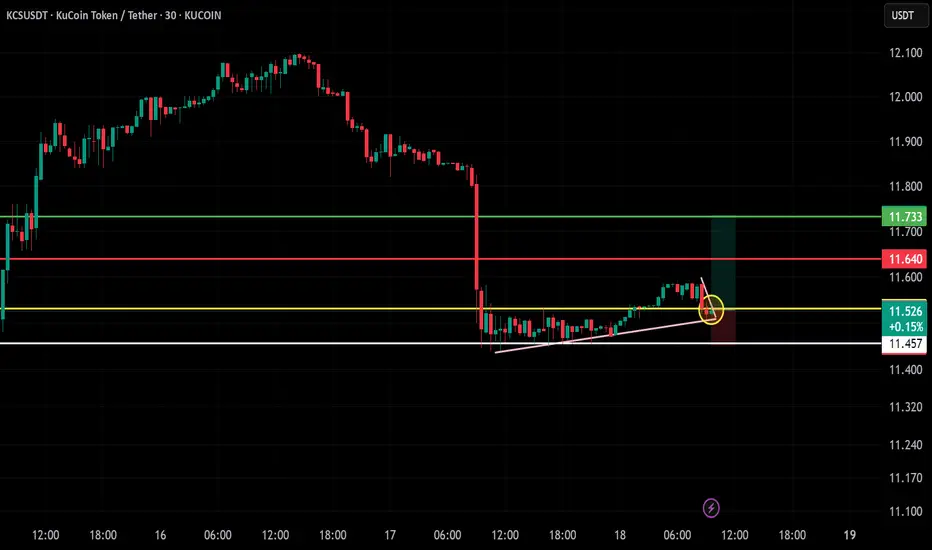
Entry Zone: Around $11.50–$11.53
Support: Holding above the ascending trendline and key support near $11.457
Breakout Retest: Price pulled back to test both the horizontal and trendline support (yellow circle) – showing confluence
Volume: Stable but likely to increase on breakout continuation
🎯 Targets & SL
Take-Profit (TP):
TP1: $11.640 (minor resistance)
TP2: $11.733 (strong resistance zone)
Stop-Loss (SL):
Below $11.457 – protects from fakeouts
⚖️ Risk-Reward Estimate:
R:R Ratio: Around 2:1 – good for swing or intraday move
Bias: Bullish (continuation from consolidation breakout)
🧠 Trade Logic
Bullish ascending triangle held support
Entry after a retest = better confirmation
Strong candle close above yellow zone would increase conviction
Disclaimer
The information and publications are not meant to be, and do not constitute, financial, investment, trading, or other types of advice or recommendations supplied or endorsed by TradingView. Read more in the Terms of Use.
Disclaimer
The information and publications are not meant to be, and do not constitute, financial, investment, trading, or other types of advice or recommendations supplied or endorsed by TradingView. Read more in the Terms of Use.