
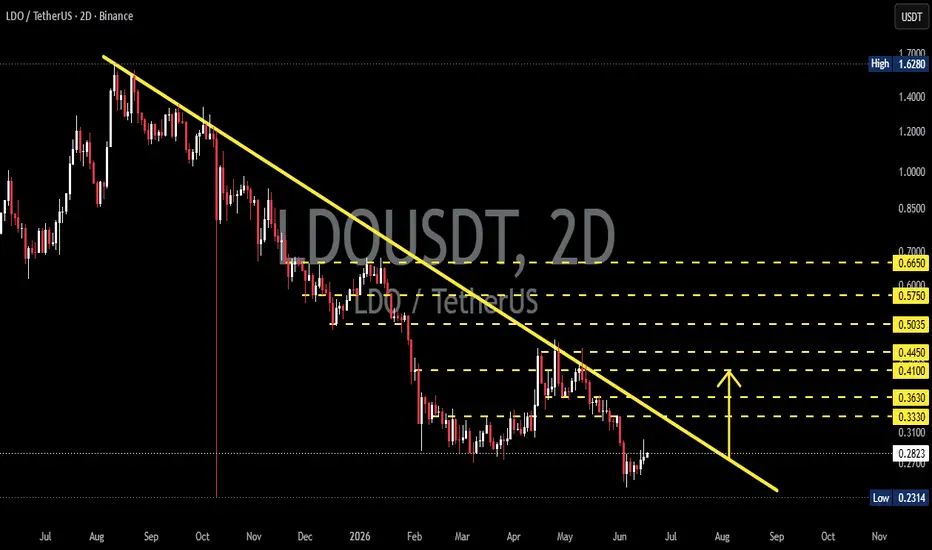
On the 2-Day (2D) timeframe, LDO/USDT remains within a medium- to long-term downtrend structure, highlighted by a strong Descending Trendline that has been acting as resistance since the August 2025 peak.
📌 The current price is trading around 0.28 USDT, following a prolonged decline from the 1.60+ USDT region.
📌 Although selling pressure continues to dominate, there are signs of a potential base formation near the current support zone, which could become an early accumulation area.
📌 The descending trendline has repeatedly acted as a dynamic resistance level, and price has yet to achieve a confirmed breakout above it.
---
📊 Structure and Pattern Overview
🔻 Descending Trendline (Primary Bearish Structure)
The main pattern visible on this chart is a Descending Trendline, indicating that every rally continues to produce Lower Highs.
Pattern Characteristics:
✅ Connects multiple significant swing highs.
✅ Acts as the primary dynamic resistance.
✅ Reflects ongoing seller dominance.
✅ A breakout above the trendline could signal a bullish market structure shift.
⚠️ As long as price remains below this trendline, the primary trend should still be considered bearish.
---
🎯 Key Resistance Levels
The major resistance levels shown on the chart are:
🔸 0.3330 USDT
🔸 0.3630 USDT
🔸 0.4100 USDT
🔸 0.4450 USDT
🔸 0.5035 USDT
🔸 0.5750 USDT
🔸 0.6650 USDT
📈 These levels may serve as sequential upside targets if a breakout occurs.
---
🛡️ Key Support Zone
Primary support:
🔹 0.2600 – 0.2314 USDT
📍 This area represents the recent low and the last major defensive zone for buyers.
📍 If this support holds, the probability of a medium-term reversal will increase significantly.
---
🚀 Bullish Scenario
For a bullish confirmation, price needs to:
✅ Hold above the 0.2600 USDT support area.
✅ Break above the Descending Trendline with strong volume.
✅ Successfully reclaim the 0.3330 USDT resistance level.
Potential Upside Targets:
🎯 0.3330 USDT
🎯 0.3630 USDT
🎯 0.4100 USDT
🎯 0.4450 USDT
🎯 0.5035 USDT
🎯 0.5750 USDT
🎯 0.6650 USDT
🚀 A confirmed breakout above the trendline would be an early indication that the accumulation phase is complete and that a new bullish structure is developing.
---
🔻 Bearish Scenario
The bearish outlook remains valid while price continues trading below the trendline.
Bearish Confirmation:
❌ Failure to break above the descending trendline.
❌ Rejection from the 0.3330 – 0.3630 USDT resistance zone.
❌ Breakdown below the 0.2600 USDT support level.
Potential Downside Target:
🎯 0.2314 USDT
⚠️ A break below this level could create a new Lower Low, extending the long-term downtrend.
---
📈 Conclusion
LDO/USDT is currently trading at a very important decision point as price approaches the end of a long-term Descending Trendline that has controlled market direction for several months.
📌 As long as the trendline remains intact, the overall market structure stays bearish.
📌 However, the closer price gets to the trendline apex, the greater the potential for a significant volatility expansion.
🚀 A breakout above the trendline would be a major trend reversal signal.
🔻 A rejection from the trendline would reinforce seller control.
🛡️ The 0.2600–0.2314 USDT zone remains the key support area that buyers must defend.
💡 In short, LDO is approaching a critical decision zone that could determine the direction of the next major trend.
#LDO #LDOUSDT #LidoDAO #Crypto 🚀 #Cryptocurrency #Altcoin #Altcoins #Trading 📊 #TechnicalAnalysis #TradingView #ChartAnalysis #PriceAction #Trendline #DescendingTrendline #Breakout #Bullish 📈 #Bearish 📉 #SupportAndResistance #SwingTrading #CryptoTrading #Binance #MarketAnalysis

✅ Get Free Signals! Join Our Telegram Channel Here: t.me/TheCryptoNuclear
✅ Twitter: twitter.com/crypto_nuclear
✅ Join Bybit : partner.bybit.com/b/nuclearvip
✅ Benefits : Lifetime Trading Fee Discount -50%
✅ Twitter: twitter.com/crypto_nuclear
✅ Join Bybit : partner.bybit.com/b/nuclearvip
✅ Benefits : Lifetime Trading Fee Discount -50%
Disclaimer
The information and publications are not meant to be, and do not constitute, financial, investment, trading, or other types of advice or recommendations supplied or endorsed by TradingView. Read more in the Terms of Use.