Chainlink (LINK) – The Final Stage of a 5-Year Compression**
The chart is telling one very clear story:
> **Chainlink is approaching the end of a 4-year descending macro trend while sitting on a 3-year accumulation floor.**
> The moment these two structures converge, a major regime shift usually follows.
**“The 5-Year Pressure Is About to Break.”**
---
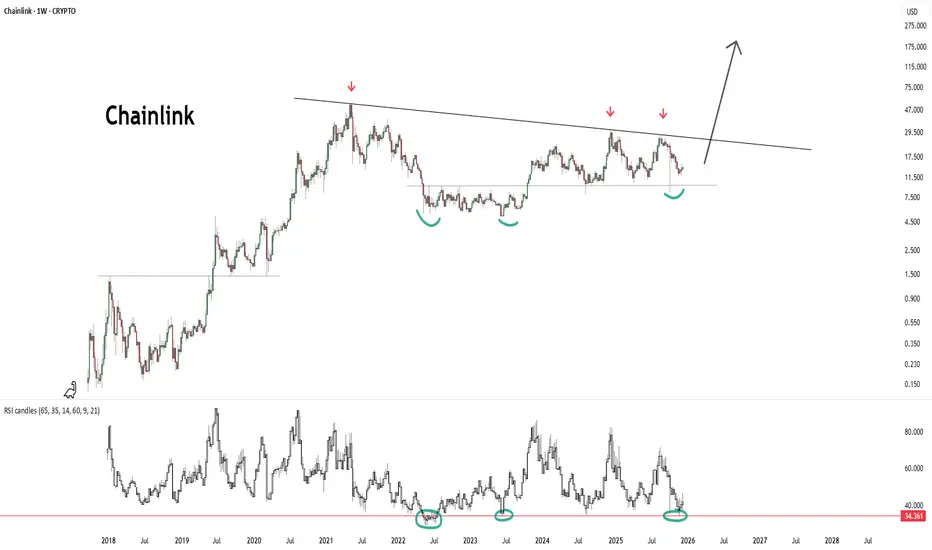
🔹 **1) The 4-Year Descending Macro Trend (2021 → 2025)**
The red arrows mark the same long-term trendline connecting the major tops of:
* 2021
* 2022
* 2024
This line has acted as the **spine of the bear market**.
And LINK is now marching **back into this line for the next major test**.
A break here is not just a trend break.
It is a **market regime shift**.
---
🔹 **2) The 3-Year Horizontal Accumulation Floor**
The green curved bottoms highlight how:
* 2022
* 2023
* 2024
* and late 2025
have all produced **identical bottom structures** around the 12–13$ region.
This is:
**A large, asymmetric inverse H&S (iH&S) structure**
Ugly, uneven, but extremely powerful.
Key observations:
* Bottoms don’t break
* Selling is absorbed
* Volatility is compressing
* Strong structural demand refuses to give way
This is **large-scale accumulation**, not weakness.
---
🔹 **3) Weekly RSI – The Macro Cycle Floor**
The RSI bottom line around **34** has marked every major cyclical low since 2018:
* 2018 bear bottom
* 2020 crash
* 2022 bear bottom
* 2023 correction
* **And right now**
LINK’s **macro oscillator cycle is at bottom territory** — a region historically followed by multi-month expansions.
---
🔹 **4) Technically, the picture is this:**
* **A 4-year descending trendline above**
* **A 3-year accumulation zone below**
* **RSI sitting at cycle lows inside**
This is the type of setup that precedes massive impulsive waves.
---
⭐ **"Chainlink is coiled inside a high-timeframe expansion structure."**
When these structures break, they don’t produce small moves —
they produce **cycle expansions**.
---
🔹 **5) Fundamental Drivers – Why This Cycle Is Different for LINK**
Chainlink now sits at the center of crypto’s real infrastructure layer.
**1) CCIP (Cross-Chain Interoperability Protocol)**
Adopted by:
* BlackRock
* DTCC
* SWIFT
* Multiple banks and RWA platforms
2024–2025 marks the first time traditional finance begins using LINK’s infrastructure at scale.
**2) Oracle fee growth**
The rise of RWA (Real-World Assets) means:
* More data feeds
* More volume
* More fees
* More burn pressure on the token economy
Chainlink’s tokenomics finally enter a structurally bullish regime.
**3) Macro Altcoin Liquidity Expansion**
In every cycle, certain infrastructure tokens become early movers.
LINK is positioned to be one of them due to:
* Dominance in the oracle sector
* Institutional integrations
* Network effects
---
🧭 **6) Probable Scenario (Technical)**
**Bullish scenario (primary expectation):**
* Break above the 4-year trendline
* Weekly close above **18–20$**
→ 29–32$
→ 46$
→ **Macro target: 70–75$**
**Bearish scenario (lower probability):**
* Breakdown below 13$
→ liquidity sweep toward 9–10$
(Indicators currently reject this scenario)
Log MACD

---
LINK/BTC 1w

LINKBTC has been compressing inside a falling wedge for nearly 6 years — one of the longest and cleanest structures in the entire market.
Multi-cycle descending trendline overhead
Perfectly defended accumulation line below
Volatility squeezed to historical lows
Sellers exhausted
Breakout energy building
LINKUSD and LINKBTC both aligning for macro upside
This is not a short-term chart.
This is a cycle-level setup.
And setups like this usually end the same way:
“Compression → Breakout → Parabolic Repricing vs Bitcoin.”
LINKBTC has been “ignored” for years because LINK’s USD pair looked stable while BTC outperformed.
But structurally:
BTC strength pushed LINKBTC down
LINK never lost its demand trendline
A massive energy coil has formed
When BTC dominance stalls or rotates,
LINKBTC normally enters a full expansion cycle.
Historically:
LINKBTC expansions are violent
They outperform BTC by 2–4× in strong phases
This pattern is setting the stage for another one.
🎯 **Conclusion
**Chainlink is approaching the most important structural point since 2020.**
The alignment is extremely rare:
* RSI at cycle lows
* Price at a 3-year demand floor
* Approaching a 4-year macro trendline
* CCIP adoption accelerating
* RWA growth pulling LINK into real-world usage
This is not a normal chart.
This is a **macro cycle setup**.
And these setups usually play out like this:
> **“Trend breaks → FOMO awakens → Expansion begins.”**
The chart is telling one very clear story:
> **Chainlink is approaching the end of a 4-year descending macro trend while sitting on a 3-year accumulation floor.**
> The moment these two structures converge, a major regime shift usually follows.
**“The 5-Year Pressure Is About to Break.”**
---
🔹 **1) The 4-Year Descending Macro Trend (2021 → 2025)**
The red arrows mark the same long-term trendline connecting the major tops of:
* 2021
* 2022
* 2024
This line has acted as the **spine of the bear market**.
And LINK is now marching **back into this line for the next major test**.
A break here is not just a trend break.
It is a **market regime shift**.
---
🔹 **2) The 3-Year Horizontal Accumulation Floor**
The green curved bottoms highlight how:
* 2022
* 2023
* 2024
* and late 2025
have all produced **identical bottom structures** around the 12–13$ region.
This is:
**A large, asymmetric inverse H&S (iH&S) structure**
Ugly, uneven, but extremely powerful.
Key observations:
* Bottoms don’t break
* Selling is absorbed
* Volatility is compressing
* Strong structural demand refuses to give way
This is **large-scale accumulation**, not weakness.
---
🔹 **3) Weekly RSI – The Macro Cycle Floor**
The RSI bottom line around **34** has marked every major cyclical low since 2018:
* 2018 bear bottom
* 2020 crash
* 2022 bear bottom
* 2023 correction
* **And right now**
LINK’s **macro oscillator cycle is at bottom territory** — a region historically followed by multi-month expansions.
---
🔹 **4) Technically, the picture is this:**
* **A 4-year descending trendline above**
* **A 3-year accumulation zone below**
* **RSI sitting at cycle lows inside**
This is the type of setup that precedes massive impulsive waves.
---
⭐ **"Chainlink is coiled inside a high-timeframe expansion structure."**
When these structures break, they don’t produce small moves —
they produce **cycle expansions**.
---
🔹 **5) Fundamental Drivers – Why This Cycle Is Different for LINK**
Chainlink now sits at the center of crypto’s real infrastructure layer.
**1) CCIP (Cross-Chain Interoperability Protocol)**
Adopted by:
* BlackRock
* DTCC
* SWIFT
* Multiple banks and RWA platforms
2024–2025 marks the first time traditional finance begins using LINK’s infrastructure at scale.
**2) Oracle fee growth**
The rise of RWA (Real-World Assets) means:
* More data feeds
* More volume
* More fees
* More burn pressure on the token economy
Chainlink’s tokenomics finally enter a structurally bullish regime.
**3) Macro Altcoin Liquidity Expansion**
In every cycle, certain infrastructure tokens become early movers.
LINK is positioned to be one of them due to:
* Dominance in the oracle sector
* Institutional integrations
* Network effects
---
🧭 **6) Probable Scenario (Technical)**
**Bullish scenario (primary expectation):**
* Break above the 4-year trendline
* Weekly close above **18–20$**
→ 29–32$
→ 46$
→ **Macro target: 70–75$**
**Bearish scenario (lower probability):**
* Breakdown below 13$
→ liquidity sweep toward 9–10$
(Indicators currently reject this scenario)
Log MACD
---
LINK/BTC 1w
LINKBTC has been compressing inside a falling wedge for nearly 6 years — one of the longest and cleanest structures in the entire market.
Multi-cycle descending trendline overhead
Perfectly defended accumulation line below
Volatility squeezed to historical lows
Sellers exhausted
Breakout energy building
LINKUSD and LINKBTC both aligning for macro upside
This is not a short-term chart.
This is a cycle-level setup.
And setups like this usually end the same way:
“Compression → Breakout → Parabolic Repricing vs Bitcoin.”
LINKBTC has been “ignored” for years because LINK’s USD pair looked stable while BTC outperformed.
But structurally:
BTC strength pushed LINKBTC down
LINK never lost its demand trendline
A massive energy coil has formed
When BTC dominance stalls or rotates,
LINKBTC normally enters a full expansion cycle.
Historically:
LINKBTC expansions are violent
They outperform BTC by 2–4× in strong phases
This pattern is setting the stage for another one.
🎯 **Conclusion
**Chainlink is approaching the most important structural point since 2020.**
The alignment is extremely rare:
* RSI at cycle lows
* Price at a 3-year demand floor
* Approaching a 4-year macro trendline
* CCIP adoption accelerating
* RWA growth pulling LINK into real-world usage
This is not a normal chart.
This is a **macro cycle setup**.
And these setups usually play out like this:
> **“Trend breaks → FOMO awakens → Expansion begins.”**
Disclaimer
The information and publications are not meant to be, and do not constitute, financial, investment, trading, or other types of advice or recommendations supplied or endorsed by TradingView. Read more in the Terms of Use.
Disclaimer
The information and publications are not meant to be, and do not constitute, financial, investment, trading, or other types of advice or recommendations supplied or endorsed by TradingView. Read more in the Terms of Use.