Capital Protection Guide: Learning from Catastrophic Drawdowns - LRN Case Study
Overview
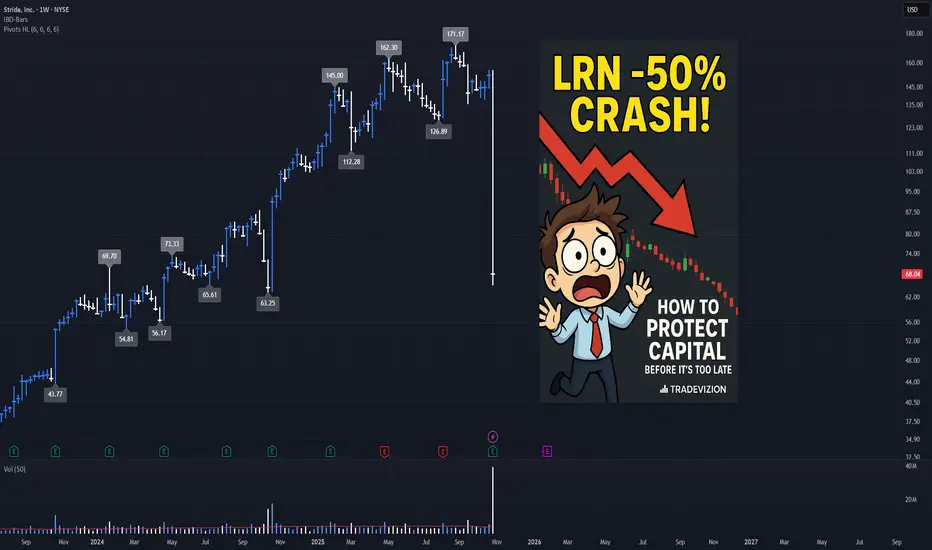
Catastrophic drawdowns—sudden, severe price declines of 30% or more in a single session—can devastate trading accounts, especially for beginners. This tutorial examines the real-world case of LRN (Stride Inc.), which lost over 50% in a single day on October 29, 2025, and provides practical strategies to protect your capital from similar disasters.
Understanding how to identify warning signs and implement proper risk management is essential for long-term trading success. While no strategy can guarantee complete protection, recognizing red flags and following disciplined capital preservation rules can significantly reduce the risk of catastrophic losses.

Understanding Catastrophic Drawdowns
What is a Catastrophic Drawdown?
A catastrophic drawdown occurs when a stock experiences an extreme price decline in a very short period—typically 10% or more in a single trading day. These events can be triggered by:
Why Beginners Are Most Vulnerable
Beginners face unique challenges when catastrophic drawdowns occur:

Case Study:LRN -50% Crash on October 29, 2025
The Event
On October 29, 2025, Stride Inc. (LRN) experienced a catastrophic one-day decline. The stock closed at $68.04 on October 29, down from $153.53 the previous day—a drop of approximately 55.7% (close-to-close). According to multiple sources, the stock experienced between 41-49% premarket/intraday declines, with some sources reporting up to 51.5% decline over a 4-week period following the earnings announcement. The close-to-close decline represents one of the most severe single-day drops in recent market history.
What Happened - Timeline of Events
The Math of Recovery
Critical lesson for beginners: If stock drops 50%, you need 100% gain just to break even. If stock drops 75%, you need 300% gain to recover. Prevention is infinitely easier than recovery.

Red Flags That Appeared Before the Crash
Red Flag #1: Legal Allegations (September 14, 2025)
What Happened:
• Lawsuit filed by Gallup-McKinley alleging fraud and deceptive practices
• Claims of artificially inflated enrollment figures
• Allegations of insufficiently licensed teachers
Why It Mattered:
• Legal issues are often a precursor to financial problems
• Governance and ethical concerns can destroy investor confidence
• This appeared 6 weeks BEFORE the crash - ample warning time
How to Monitor:
• Set up Google Alerts for "[Company Name] lawsuit" or "[Company Name] legal"
• Check SEC filings regularly
• Monitor news sources like Globe Newswire, MarketWatch

Red Flag #2: Operational Challenges (Summer 2025)
What Happened:
• Failed platform upgrade causing poor customer experience
• Higher withdrawal rates than anticipated
• Lower conversion rates
• Estimated 10,000-15,000 enrollment shortfall
Why It Mattered:
• Operational failures directly impact revenue
• Customer dissatisfaction leads to lost business
• Enrollment declines = revenue declines
How to Monitor:
• Read company earnings call transcripts
• Monitor customer reviews and complaints
• Watch for guidance reductions or warnings
Red Flag #3: Guidance Cut (October 29, 2025)
What Happened:
• FY26 growth forecast slashed from 19% historical average to only 5%
• This represents a 74% reduction in expected growth
• Investors immediately understood the implications
Why It Mattered:
• Growth rate cuts signal fundamental problems
• 5% growth vs 19% historical = massive disappointment
• Forward-looking statements are often more important than past results
How to Monitor:
• Compare new guidance to historical performance
• Watch for percentage reductions in growth forecasts
• Compare to analyst expectations

Red Flag #4: Volume Expansion (Days Before Crash)
What to Look For:
• Volume spikes of 2.5x+ average volume
• Unusually high volume on down days
• Declining volume on rallies (bearish divergence)
Why It Matters:
• High volume + falling price = Institutional selling
• Volume often leads price action
• Large players exiting before the crash
How to Monitor in TradingView:
Red Flag #5: Support Level Breakdowns
What to Look For:
• Price breaking below key support levels
• Support levels tested 3+ times before breaking
• Volume increase on support breaks
Why It Matters:
• Support breaks often trigger further selling
• Each failed support test weakens the level
• Break below major support = potential cascade
How to Identify in TradingView:

Red Flag #6: Volatility Expansion
What to Look For:
• Average True Range (ATR) exceeding 2x normal levels
• Increased daily price ranges (high-low spreads)
• Unusual intraday swings
Why It Matters:
• High volatility often precedes major moves
• Sudden volatility expansion can signal institutional activity
• Increased uncertainty = increased risk
How to Monitor in TradingView:
Capital Protection Strategies
Strategy 1: Position Sizing Rules
The Golden Rule: Never risk more than 1-2% of total capital per trade
How to Calculate Position Size:
Pine Script®
Example: If you have $10,000 and want to risk 2% ($200) with a 5% stop-loss, your maximum position would be $4,000. This ensures that if your stop is hit, you only lose 2% of your account, not more.
Why It Works:
Strategy 2: Stop-Loss Discipline
Always Use Stop-Losses - No Exceptions
Types of Stop-Losses:
Critical Rules:
Strategy 3: Early Exit Discipline
Why This Matters: If a stock drops 50%, you need it to gain 100% just to break even. That's why early exits are crucial—better to exit at -10% than wait for catastrophic losses. Accept small losses as the cost of doing business.
Strategy 4: Diversification Rules
Never Put All Eggs in One Basket
Diversification Guidelines:
Example: Instead of putting 50% in one stock, spread it across multiple sectors: 5-10% in Tech, 5-10% in Healthcare, 5-10% in Energy, etc. This way, a single catastrophic drawdown can't destroy your entire account.
Why It Works:
Strategy 5: Risk Monitoring System
Create Your Own Risk Score:
Monitor these factors daily:
Risk Score Interpretation:
Example: If a stock has a lawsuit filed (+25), operational issues (+20), volatility spike (+25), and volume anomaly (+20), the risk score would be 90—triggering an immediate exit signal.
How Early Detection Could Have Helped
In the LRN case, red flags appeared weeks before the crash:
By monitoring these red flags and following the risk scoring system, traders could have exited before the catastrophic crash, preserving capital for better opportunities.
Why Protection Matters:
Daily Protection Routine
Key Takeaways
Conclusion
Catastrophic drawdowns likeLRN's ~56% crash can devastate trading accounts, especially for beginners. However, by understanding red flags (like the lawsuit that appeared 6 weeks before), implementing proper risk management, and maintaining discipline, traders can significantly reduce the risk of catastrophic losses.
While no strategy can guarantee complete protection, combining technical analysis, fundamental monitoring, risk management, and discipline can help protect your capital and ensure you can trade another day.
Stay disciplined. Protect your capital. Trade another day. 🛡️
Overview
Catastrophic drawdowns—sudden, severe price declines of 30% or more in a single session—can devastate trading accounts, especially for beginners. This tutorial examines the real-world case of
Understanding how to identify warning signs and implement proper risk management is essential for long-term trading success. While no strategy can guarantee complete protection, recognizing red flags and following disciplined capital preservation rules can significantly reduce the risk of catastrophic losses.
Understanding Catastrophic Drawdowns
What is a Catastrophic Drawdown?
A catastrophic drawdown occurs when a stock experiences an extreme price decline in a very short period—typically 10% or more in a single trading day. These events can be triggered by:
- Earnings surprises: Missed expectations or guidance cuts
- Regulatory news: Government actions or policy changes
- Sector rotation: Money rapidly exiting entire sectors
- High-frequency trading: Algorithmic selling creating cascading effects
- Margin calls: Forced selling accelerating declines
- Black swan events: Unexpected crises affecting specific stocks or sectors
Why Beginners Are Most Vulnerable
Beginners face unique challenges when catastrophic drawdowns occur:
- Position Sizing Mistakes: Often risk too much capital on single trades
- Lack of Stop-Loss Discipline: Emotional attachment prevents cutting losses
- Overconfidence: Good runs create false confidence in risky positions
- Ignoring Red Flags: Missing early warning signs of trouble
- Averaging Down: Doubling down on losing positions instead of exiting
Case Study:
The Event
On October 29, 2025, Stride Inc. (
Key Event Details:
• Crash Date: October 29, 2025
• Previous Close (Oct 28): $153.53
• Crash Day Close (Oct 29): $68.04
• Drop Magnitude: ~56% close-to-close (reported 41-49% intraday/premarket)
• Primary Causes: Weak FY26 outlook, failed platform upgrade, legal allegations
• Enrollment Impact: 10,000-15,000 student shortfall
• Growth Forecast: Slashed from 19% historical to 5% projected
• Earnings Report: Q1 FY26 reported October 28, 2025 (beat estimates but weak guidance)
What Happened - Timeline of Events
- Summer 2025: Stride attempted to implement an upgraded platform that failed to proceed as planned, resulting in poor customer experience and higher withdrawal rates.
- September 14, 2025: Gallup-McKinley County Schools Board of Education filed a lawsuit against Stride, alleging fraud, deceptive practices, and inflated enrollment figures. This was a major red flag that appeared 6 weeks before the crash.
- October 28, 2025: Q1 FY26 earnings reported after market close—beat estimates ($1.52 vs $1.23 expected) BUT guidance for FY26 was weak (only 5% growth vs 19% historical).
- October 29, 2025: Market opened and stock crashed:
• Premarket: Down ~41%
• Intraday: Declined further to ~49% intraday
• Close: Stock closed at $68.04 (down ~56% from previous close of $153.53)
• Weak financial forecast for FY26 confirmed fears
• Platform upgrade issues causing enrollment shortfall confirmed
The Math of Recovery
Critical lesson for beginners: If stock drops 50%, you need 100% gain just to break even. If stock drops 75%, you need 300% gain to recover. Prevention is infinitely easier than recovery.
Red Flags That Appeared Before the Crash
Red Flag #1: Legal Allegations (September 14, 2025)
What Happened:
• Lawsuit filed by Gallup-McKinley alleging fraud and deceptive practices
• Claims of artificially inflated enrollment figures
• Allegations of insufficiently licensed teachers
Why It Mattered:
• Legal issues are often a precursor to financial problems
• Governance and ethical concerns can destroy investor confidence
• This appeared 6 weeks BEFORE the crash - ample warning time
How to Monitor:
• Set up Google Alerts for "[Company Name] lawsuit" or "[Company Name] legal"
• Check SEC filings regularly
• Monitor news sources like Globe Newswire, MarketWatch
Red Flag #2: Operational Challenges (Summer 2025)
What Happened:
• Failed platform upgrade causing poor customer experience
• Higher withdrawal rates than anticipated
• Lower conversion rates
• Estimated 10,000-15,000 enrollment shortfall
Why It Mattered:
• Operational failures directly impact revenue
• Customer dissatisfaction leads to lost business
• Enrollment declines = revenue declines
How to Monitor:
• Read company earnings call transcripts
• Monitor customer reviews and complaints
• Watch for guidance reductions or warnings
Red Flag #3: Guidance Cut (October 29, 2025)
What Happened:
• FY26 growth forecast slashed from 19% historical average to only 5%
• This represents a 74% reduction in expected growth
• Investors immediately understood the implications
Why It Mattered:
• Growth rate cuts signal fundamental problems
• 5% growth vs 19% historical = massive disappointment
• Forward-looking statements are often more important than past results
How to Monitor:
• Compare new guidance to historical performance
• Watch for percentage reductions in growth forecasts
• Compare to analyst expectations
Red Flag #4: Volume Expansion (Days Before Crash)
What to Look For:
• Volume spikes of 2.5x+ average volume
• Unusually high volume on down days
• Declining volume on rallies (bearish divergence)
Why It Matters:
• High volume + falling price = Institutional selling
• Volume often leads price action
• Large players exiting before the crash
How to Monitor in TradingView:
- Add Volume Moving Average indicators (20 and 50 period)
- Compare current volume to averages
- Set alert when volume > 2.5x average
Red Flag #5: Support Level Breakdowns
What to Look For:
• Price breaking below key support levels
• Support levels tested 3+ times before breaking
• Volume increase on support breaks
Why It Matters:
• Support breaks often trigger further selling
• Each failed support test weakens the level
• Break below major support = potential cascade
How to Identify in TradingView:
- Use pivot low function to find support levels
- Draw horizontal lines at key support using drawing tools
- Track number of touches (3+ = strong support)
- Exit immediately when support breaks
Red Flag #6: Volatility Expansion
What to Look For:
• Average True Range (ATR) exceeding 2x normal levels
• Increased daily price ranges (high-low spreads)
• Unusual intraday swings
Why It Matters:
• High volatility often precedes major moves
• Sudden volatility expansion can signal institutional activity
• Increased uncertainty = increased risk
How to Monitor in TradingView:
- Add ATR (Average True Range) indicator
- Compare current ATR to 20-period average
- Calculate ratio: Current ATR / Average ATR
- Alert when ratio exceeds 2.0 (volatility spike)
Capital Protection Strategies
Strategy 1: Position Sizing Rules
The Golden Rule: Never risk more than 1-2% of total capital per trade
How to Calculate Position Size:
Position Size = (Account × Risk %) / Stop-Loss %
Example: If you have $10,000 and want to risk 2% ($200) with a 5% stop-loss, your maximum position would be $4,000. This ensures that if your stop is hit, you only lose 2% of your account, not more.
Why It Works:
- Limits maximum loss on any single trade
- Allows you to survive multiple losses
- Preserves capital for better opportunities
Strategy 2: Stop-Loss Discipline
Always Use Stop-Losses - No Exceptions
Types of Stop-Losses:
- Fixed Percentage Stop:
• Example: 5% below entry
• Pros: Simple, consistent
• Cons: May not account for volatility - Support-Based Stop:
• Place below nearest support level
• Pros: Respects technical structure
• Cons: Requires chart analysis - ATR-Based Stop:
• Stop = Entry - (2 × ATR)
• Pros: Adapts to volatility
• Cons: May be too wide in volatile markets - Trailing Stop:
• Moves up as price increases
• Pros: Protects profits automatically
• Cons: Can exit during normal pullbacks
Critical Rules:
- ✅ Set stops immediately after entry
- ✅ Never move stops away from price
- ✅ Only move stops closer (trailing up)
- ✅ Never remove stops "temporarily"
- ✅ If stopped out, stay out (don't revenge trade)
Strategy 3: Early Exit Discipline
Why This Matters: If a stock drops 50%, you need it to gain 100% just to break even. That's why early exits are crucial—better to exit at -10% than wait for catastrophic losses. Accept small losses as the cost of doing business.
Strategy 4: Diversification Rules
Never Put All Eggs in One Basket
Diversification Guidelines:
- Maximum 5-10% of capital in single stock
- Diversify across sectors (not just stocks)
- Keep 20-30% cash for opportunities
- Don't over-concentrate in similar stocks
Example: Instead of putting 50% in one stock, spread it across multiple sectors: 5-10% in Tech, 5-10% in Healthcare, 5-10% in Energy, etc. This way, a single catastrophic drawdown can't destroy your entire account.
Why It Works:
- Single catastrophic drawdown can't destroy account
- Other positions can offset losses
- Cash available for opportunities
Strategy 5: Risk Monitoring System
Create Your Own Risk Score:
Monitor these factors daily:
- Volatility (0-25 points)
• ATR > 2x average = +25 points - Volume (0-20 points)
• Volume spike = +20 points - Support Breaks (0-25 points)
• Major support break = +25 points - Momentum (0-15 points)
• RSI overbought = +10 points
• Bearish divergence = +15 points - Gap-Downs (0-15 points)
• 3%+ gap down = +15 points - Legal/Operational Issues (0-25 points)
• Lawsuit filed = +25 points
• Guidance cuts = +20 points
Risk Score Interpretation:
- 0-29: LOW risk - Normal trading
- 30-49: MODERATE - Increase caution, tighten stops
- 50-69: HIGH - Reduce position size by 50%
- 70-100: CRITICAL - Exit immediately
Example: If a stock has a lawsuit filed (+25), operational issues (+20), volatility spike (+25), and volume anomaly (+20), the risk score would be 90—triggering an immediate exit signal.
How Early Detection Could Have Helped
In the LRN case, red flags appeared weeks before the crash:
- September 14, 2025 (6 weeks before): Lawsuit filed → Risk score +25 → Monitor closely
- Summer 2025: Platform upgrade failure → Risk score +20 → Total 45 = MODERATE → Reduce position size
- October 29, 2025: Guidance cut → Risk score +20 → Total 65+ = CRITICAL → Exit immediately
By monitoring these red flags and following the risk scoring system, traders could have exited before the catastrophic crash, preserving capital for better opportunities.
Why Protection Matters:
Without Protection:
• Lost ~56% in one day
• Account severely damaged
• Needs 127% gain just to break even
With Protection:
• Exited at -5% to -10% (after red flags appeared)
• Small, manageable loss
• Capital preserved for better opportunities
• Can trade another day
Daily Protection Routine
- ✅ Morning: Review positions, check news/lawsuits, verify stop-losses
- ✅ During Trading: Monitor for red flags, watch volume/volatility spikes
- ✅ End of Day: Review alerts, adjust stops (only closer, never further)
Key Takeaways
- Capital preservation is #1 - You can always find another trade, but lost capital is hard to recover
- Always use stop-losses - Set immediately after entry, never move away from price
- Watch for red flags - Multiple warnings = exit signal. Better to exit early than late.
- Position sizing matters - Risk only 1-2% per trade, maximum 5-10% in single stock
- Monitor news daily - Legal issues and guidance cuts often precede crashes
- Use the risk scoring system - Combine technical indicators with fundamental news for better protection
Conclusion
Catastrophic drawdowns like
While no strategy can guarantee complete protection, combining technical analysis, fundamental monitoring, risk management, and discipline can help protect your capital and ensure you can trade another day.
Remember: The goal isn't to avoid all losses—it's to avoid catastrophic losses that can destroy your trading account.
Stay disciplined. Protect your capital. Trade another day. 🛡️
TradeVizion™
For our premium indicators! whop.com/tradevizion/
For our premium indicators! whop.com/tradevizion/
Disclaimer
The information and publications are not meant to be, and do not constitute, financial, investment, trading, or other types of advice or recommendations supplied or endorsed by TradingView. Read more in the Terms of Use.