M&M Fin (W) - Renewed Strength within a Multi-Year Consolidation
After more than two years of trading in a sideways range, M&M Financial Services is showing strong signs of renewed buyer interest, suggesting a potential move towards the top of its long-term consolidation channel.
The Big Picture: A Prolonged Consolidation
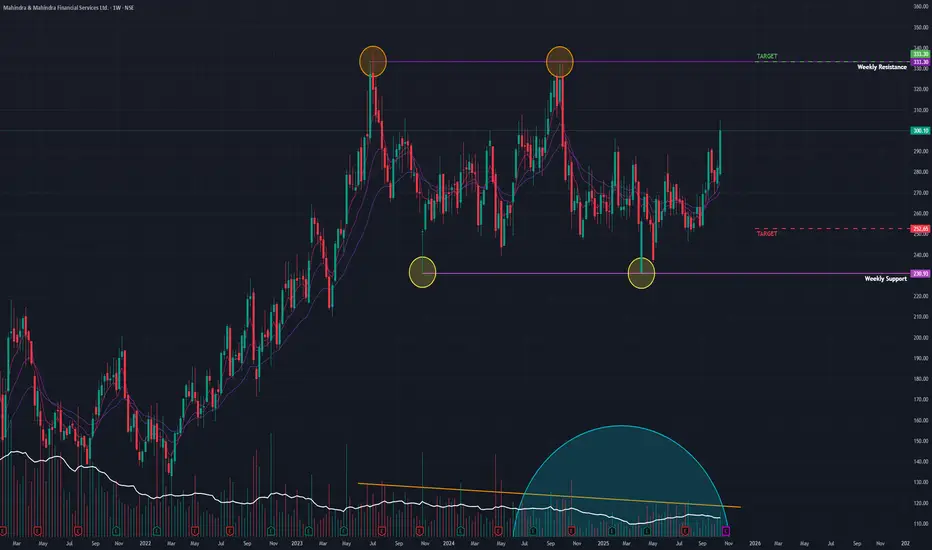
Since reaching its All-Time High (ATH) in July 2023, the stock has been locked in a wide consolidation or sideways trend. A classic and often bullish sign during this phase has been the gradual drying up of trading volume, which typically indicates that selling pressure is diminishing.
Recent Bullish Action
The past week marked a significant shift in activity, signaling that bulls are becoming active again:
- The stock surged by +6.38% for the week.
- This move was supported by a strong volume of 15.49 million shares, indicating conviction behind the buying.
This renewed interest is supported by the underlying strength seen in higher timeframe indicators. Both the short-term Exponential Moving Averages (EMAs) and the Relative Strength Index (RSI) are in a bullish state on the *Monthly and Weekly charts.
Outlook and Key Levels
While the ultimate goal for bulls is a breakout above the distant ATH, the immediate battleground is the established trading range.
- Upside Target: The primary target in the near term is the upper limit of the consolidation range, around the ₹333 level. A breakout above this would be the next major bullish signal.
- Key Support: If this recent momentum fades, the stock is likely to find strong support at the lower boundary of its range, near the ₹250 level.
In conclusion, last week's strong performance suggests M&M Financial is preparing to challenge the top of its long-term range. The key now is to watch if this momentum can be sustained for a move towards the ₹333 resistance.
The Big Picture: A Prolonged Consolidation
Since reaching its All-Time High (ATH) in July 2023, the stock has been locked in a wide consolidation or sideways trend. A classic and often bullish sign during this phase has been the gradual drying up of trading volume, which typically indicates that selling pressure is diminishing.
Recent Bullish Action
The past week marked a significant shift in activity, signaling that bulls are becoming active again:
- The stock surged by +6.38% for the week.
- This move was supported by a strong volume of 15.49 million shares, indicating conviction behind the buying.
This renewed interest is supported by the underlying strength seen in higher timeframe indicators. Both the short-term Exponential Moving Averages (EMAs) and the Relative Strength Index (RSI) are in a bullish state on the *Monthly and Weekly charts.
Outlook and Key Levels
While the ultimate goal for bulls is a breakout above the distant ATH, the immediate battleground is the established trading range.
- Upside Target: The primary target in the near term is the upper limit of the consolidation range, around the ₹333 level. A breakout above this would be the next major bullish signal.
- Key Support: If this recent momentum fades, the stock is likely to find strong support at the lower boundary of its range, near the ₹250 level.
In conclusion, last week's strong performance suggests M&M Financial is preparing to challenge the top of its long-term range. The key now is to watch if this momentum can be sustained for a move towards the ₹333 resistance.
Disclaimer: This analysis is my personal view & for educational purposes only. They shall not be construed as trade or investment advice. Before making any financial decision, it is imperative that you consult with a qualified financial professional.
Disclaimer
The information and publications are not meant to be, and do not constitute, financial, investment, trading, or other types of advice or recommendations supplied or endorsed by TradingView. Read more in the Terms of Use.