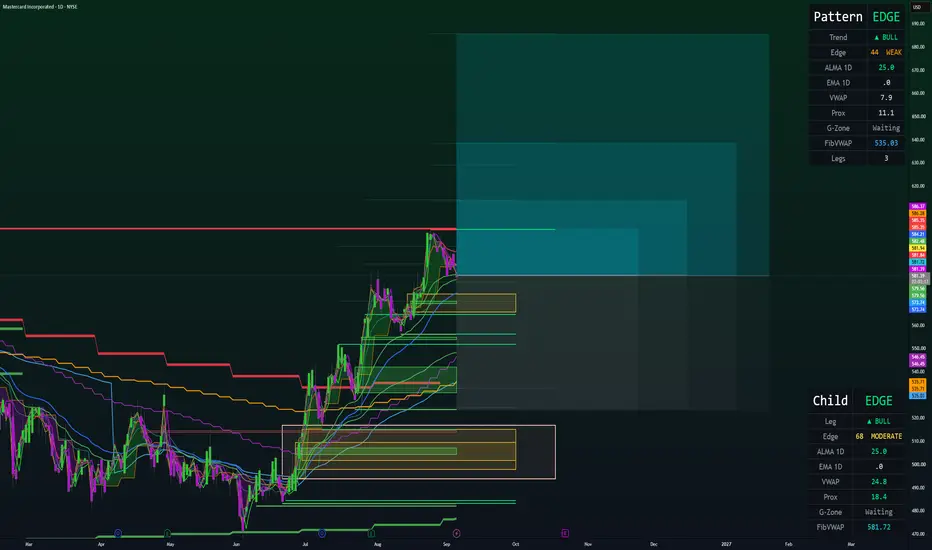
 MA · 1D · long only.
(Context: Mastercard — global card network / payments + value-added services — consumer-spend and rate/policy beta on the 1D ALMA Averaging template.)
═
█ RESEARCH HUB
Category: US stocks sentiment 58.1 (Greed) — broad equity gauge constructive; MA path is the payments pair window below.
Sector: US · Financials 84.6 (Extreme greed) — built from 40 locked notes (34 constructive / 3 risk-off / 2 mixed). Sector greed is backdrop; name tape is ATH → fade digestion.
Asset: mixed / moderately positive (equity brief 04 Sep · window 05 Aug–04 Sep). ~$570.48 (05 Aug) → peak ~$599.86 (24 Aug) → ~$582.11 (04 Sep close); 30d ~+2.0%; ~−3.0% from peak. Analyst PT raises + consumer ATH day vs late-Aug rate fade.
Tape:
- 2026-08-05…14 · constructive · Truist Buy PT $633 (05 Aug) · Bernstein $710 (12 Aug) · DBS $625 (14 Aug) — Street bid into mid-Aug.
- 2026-08-07 · mixed · dividend paid $0.87/qtr; same week early dip close ~$562.95 (−2.3%).
- 2026-08-21…24 · constructive · V/MA pair-rally on resilient US consumer; BofA card spend July +5.0% y/y; MA +3.3% to close ~$599.86 (intraday ~$599.99 — record area).
- 2026-08-24 · risk-off overlay · CCCA / interchange scrutiny restated as perennial policy risk into the ATH print.
- 2026-08-25…28 · constructive · Wolfe Outperform PT $740 (25 Aug) · RBC Buy $696 (28 Aug) — Street high / consensus lift.
- 2026-08-31…04.09 · risk-off · fade ~$600→~$581–582 on hike/yields week; 7d ~−2.2%; tape still ~13% below Wolfe $740 / ~13% below consensus ~$667.
Calendar:
- ~2026-09-15 · dividend declare (pattern) · direct · flow
- 2026-10-29 · Q3 FY26 earnings · direct · earnings
- ongoing · CCCA / interchange legislative noise · direct · policy
- Sep window · US jobs / CPI / FOMC path · indirect (consumer + rate beta) · macro
Hub verdict: Financials Extreme greed vs a mixed-moderately-positive name window: mid-Aug consumer ATH ~$600 plus stacked PT raises built the bid; late-Aug/Jackson Hole fade left tape ~$582 — still below Street ~$667–740. Hub frames a post-ATH digestion long on the daily Averaging clock under the ~$600 shelf, with CCCA as policy overlay.
═
█ MARKET EDGE
Long Edge 7.8 · Short Edge −6.1 (04 Sep snap ~580.15 · fill ~580.73).
Built from: HTF EMA still Above · daily ALMA OVERHEAT-S · VWAP Support touch · SMC bull FVG raids — soft repair skew on a thin score board.
Positive factors
- ALMA — 1D SHORT OVERHEAT-S · S:8 vs SAvg:3.8 — daily execution band stretched short vs its own average run (Averaging fuel on the Idea clock)
- VWAP — Support ~581.72 (from 12 Aug) — chart touch Support; fill ~580.73 tags the active support shelf
- SMC — 4H FVG Enter Bull ~584–586 (03 Sep) · B57% / Br43% — nearby 4H demand into the arm
- SMC — 1D FVG Raid Bull ~585.71 (03 Sep) · B58.2% / Br41.8% — daily bull raid skew near the fill
- PA — HTF bullish FVG formed + filled — higher-TF demand housekeeping on the board
- Score skew soft long ~7.8 vs short ~−6.1 — soft repair tilt
Negative factors
- ALMA — 1W LONG OVERHEAT-L · L:11 vs LAvg:3.9 — weekly band stretched long while daily is OVERHEAT-S (TF war)
- EMA — 4H Above · Cur L:99 · Dev −0.1% — 4H time-stretched Above and pinned at the line (late / fragile on the mid clock)
- SMC — 1D OB Enter Bear ~585.71 (03 Sep) · B41.2% / Br58.8% — bear inventory pocket coexists with the bull raid
- SMC — 1W OB Enter Bear ~595.3 (24 Aug) · B23.5% / Br76.5% — weekly supply near the ATH shelf
- VWAP — Resistance ~591.68 (from 25 Aug) overhead — first reclaim shelf under the ~$600 peak
- TL — Support Break (27 Aug) · B68% / Br32% — recent support-break skew on the fade
- Edge scores are thin (Long only ~8) — first lot only (1 of 4) leaves thin cushion if payments gap lower before adds qualify
═
█ DESK
Hub is mixed-moderately positive on the name (ATH + PT stack vs −3% fade and CCCA overlay) while Financials sits in Extreme greed. Edge is a soft repair tilt (Long 7.8 vs Short −6.1) from daily ALMA OVERHEAT-S into VWAP Support ~581.7, with HTF EMA still Above. Alignment: daily Averaging arm into the post-ATH / hike-fade pocket (~$580.73 on 04 Sep 13:30 UTC). Visa 3D sister on the same session is desk-only (gate FAIL).
Bar-close refill on 1D at the active VWAP Support shelf after the ~$600→~$582 digestion — process entry first, consumer ATH headline second.
Takeaway: the 1D ALMA strategy and 79% WR / 2.6 avg RR support a disciplined first-lot arm ~$580.73 into post-ATH fade, with daily ALMA OVERHEAT-S, VWAP Support ~581.7, 4H/1D bull FVG demand, and a mixed-moderately-positive Hub window (PT raises · consumer ATH · Street ~$667) framing repair fuel — while Financials Extreme greed, weekly ALMA OVERHEAT-L vs daily OVERHEAT-S, 4H EMA L:99 at the line, weekly bear OB near ~595, and thin Edge scores with only 1/4 filled keep the path a grind under ~$600; nominal risk stays on the −10% hard stop / Pine exit path.
Base case: follow 1D ALMA Averaging · hold/add on qualifying daily closes while the ~580–586 support / FVG pocket digests · mean-revert toward the ~590–600 VWAP Resistance / ATH shelves if payments beta holds above the stop zone.
Bear case: lose the ~580–582 VWAP Support cluster · rate / CCCA headlines reprice · template posts −10% toward ~$522.7 from the working average · wait for the next bar-close arm.
═
█ STRATEGY
ALMA Averaging Strategy: ALMA 3 / σ2, SD band 2, min diff 3/3, 25% per bar, up to 4 adds, hard stop −10% from the working average.
Lots (1 of 4):
- Lot 1 — 04 Sep 13:30 UTC ~580.73
Working average ~580.73. Hard stop −10% from that average ~522.66.
Adds 2–4 stay 25% per bar if lower closes qualify.
Strategy Tester (MA 1D):
Win rate 79% · profit factor 3.4 · max drawdown 7%
Avg winning trade +18.6% · avg losing trade −7.2%
Typical hold ~57×1D bars on winners — large-cap payments mean-reversion grid on the daily Averaging template · 197-trade sample
Exits when the Above-ALMA run clears its historical average (min diff) or the −10% hard stop from the working average.
Chart:
MA 1D — ALMA Averaging Strategy.Educational idea. Live position — past backtest ≠ future results. NFA.
Trade active
Update: The MA 12H ALMA long cycle began on September 9 and accumulated four fills through September 11. The strategy closed the lots in stages between October 9 and October 13, with the final lot exiting at $599.93 on October 13. Journaled lot-level model returns ranged from +3.89% to +6.12%. This MA 12H cycle is now closed.
1,387 trades · WR 58.5% · avg hold 11.2d · avg RR +1.5 · max DD 6.7%
Crypto · stocks · indices · commodities · FX
Market Edge: technical scoring
Research Hub: news & fundamentals. Metrics on my site — link below
Educational only · NFA
Crypto · stocks · indices · commodities · FX
Market Edge: technical scoring
Research Hub: news & fundamentals. Metrics on my site — link below
Educational only · NFA
Disclaimer
The information and publications are not meant to be, and do not constitute, financial, investment, trading, or other types of advice or recommendations supplied or endorsed by TradingView. Read more in the Terms of Use.