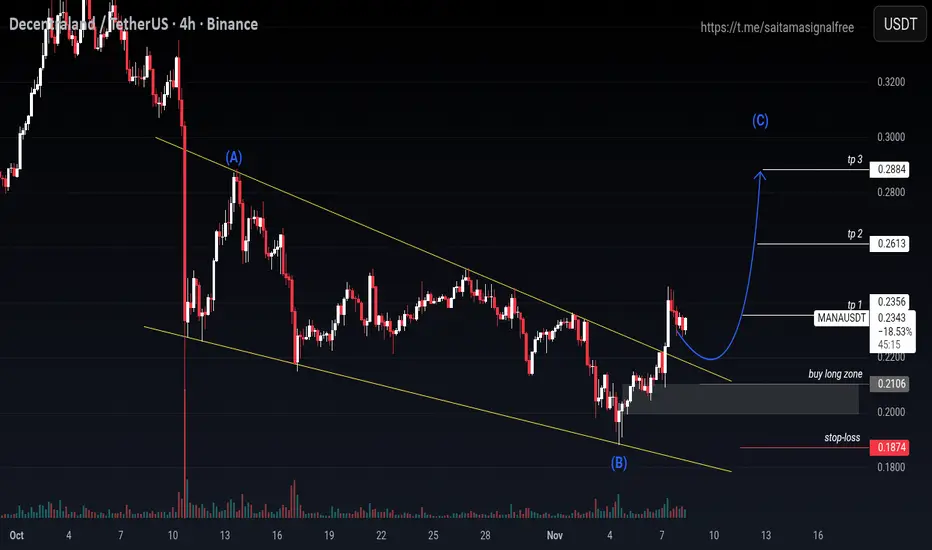
MANA/USDT 4H chart was previously in a descending channel (regular decline). Points (A) and (B) here illustrate a corrective pattern similar to the Elliott Wave ABC structure, where: (A) = corrective peak (B) = corrective bottom (strong support) The next logical target is (C), which is a rebound/relief rally. And indeed, a breakout from the descending channel has been seen, indicating the end of the downward phase and the market has entered the initial phase of an uptrend.
Disclaimer
The information and publications are not meant to be, and do not constitute, financial, investment, trading, or other types of advice or recommendations supplied or endorsed by TradingView. Read more in the Terms of Use.
Disclaimer
The information and publications are not meant to be, and do not constitute, financial, investment, trading, or other types of advice or recommendations supplied or endorsed by TradingView. Read more in the Terms of Use.