 MGC1!
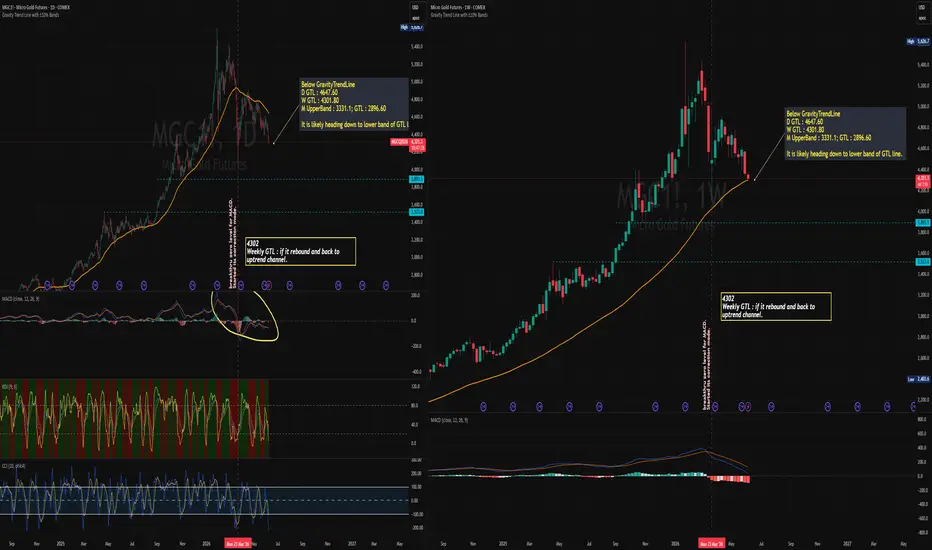
multi-week correction after pulling back from its historical highs. Over the past few sessions, selling pressure has intensified significantly.Current Spot/Price Level: ~$4,319.20
Daily Trend: Downward (−1.06% on the session, compounding a massive ~3.1% to 3.5% drop from Friday’s close).
Overall Market Sentiment: Strong Sell across dominant daily metrics.
D Gravity TrendLine : 4648; It is very likely to remains weak and extend its losses.
W Chart :
MACD : Dead-Cross formed on 23Mar26 - It broke it uptrend channel and continue remains deep in negative territory; indicating that downward momentum is firmly in control and has not yet bottomed out.
CCI & RSI remained at weak bearish zone.
D Chart : Friday broke and closed below MA200.
If it continues to falls ; it may find the next support level at :
🗝️S1: 4230
🗝️S2: 3893
🗝️S3: 3523
Mange your risk.
Follow your risk/reward ratio and trade plan!
Trade with plan.
✅ Buy only after reclaim confirmation
✅ Tactical shorts at weak rebounds possible
❌ Do Not Catch Falling Knives

Related publications
Disclaimer
The information and publications are not meant to be, and do not constitute, financial, investment, trading, or other types of advice or recommendations supplied or endorsed by TradingView. Read more in the Terms of Use.
Related publications
Disclaimer
The information and publications are not meant to be, and do not constitute, financial, investment, trading, or other types of advice or recommendations supplied or endorsed by TradingView. Read more in the Terms of Use.