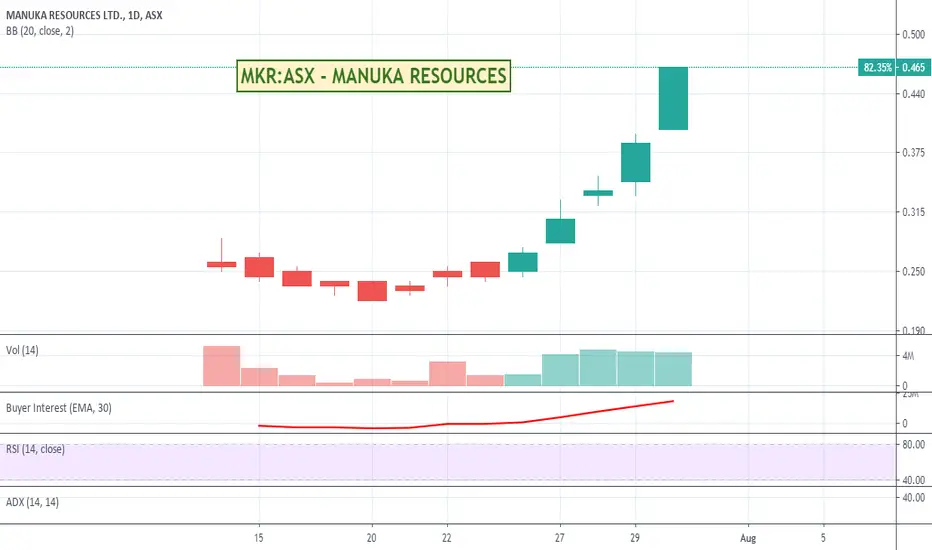
Finer Market Points: ASX Top 10 Momentum Stocks: 14 Dec 2023AMEX:TTT ASX:MKR SET:PLT NYSE:GHY ASX:RIM ASX:TSO ASX:ZIP ASX:SIG AMEX:VHT NYSE:ERO
Momentum leading shares are the market's best performers today. They are the fastest-growing shares on the ASX over the last 90 days. These companies can't get to be leaders without first appearin
−0.040AUD
−26.34 MAUD
9.90 MAUD
225.19 M
About MANUKA RESOURCES LTD.
Sector
Industry
Headquarters
Sydney
Website
Founded
2016
ISIN
AU0000090292
FIGI
BBG00GGKD5W1
Manuka Resources Ltd. is a mining company, which engages in mining and exploration of gold and silver in Australia. It operates through the following segment: Exploration NZ, Exploration Australia, and Operations. The Exploration NZ segment focuses on mining and exploration leases at the Taranaki VTM Project. The Exploration Australia segment is involved in the exploration of existing gold and silver leases and exploration leases at Wonawinta and Mt Boppy projects. The Operations segment refers to the appraisal, development, and processing of gold and silver deposits. The company was founded by Haydn John Lynch on April 20, 2016 and is headquartered in Sydney, Australia.

Trade directly on the supercharts through our supported, fully-verified and user-reviewed brokers.


Frequently Asked Questions
The current price of MKR is 0.09 AUD — it has decreased by 1.16% in the past 24 hours.
Depending on the exchange, the stock ticker may vary. For instance, on ASX exchange MANUKA RESOURCES LTD. stocks are traded under the ticker MKR.
MANUKA RESOURCES LTD. is going to release the next earnings report on Sep 27, 2024. Keep track of upcoming events with our Earnings Calendar.
Yes, you can track MANUKA RESOURCES LTD. financials in yearly and quarterly reports right on TradingView.
MKR stock has fallen by 3.41% compared to the previous week, the month change is a 8.97% rise, over the last year MANUKA RESOURCES LTD. has showed a 3.66% increase.
Like other stocks, MKR shares are traded on stock exchanges, e.g. Nasdaq, Nyse, Euronext, and the easiest way to buy them is through an online stock broker. To do this, you need to open an account and follow a broker's procedures, then start trading. You can trade MANUKA RESOURCES LTD. stock right from TradingView charts — choose your broker and connect to your account.
EBITDA measures a company's operating performance, its growth signifies an improvement in the efficiency of a company. MANUKA RESOURCES LTD. EBITDA is −11.87 M AUD, and current EBITDA margin is −167.21%. See more stats in MANUKA RESOURCES LTD. financial statements.