
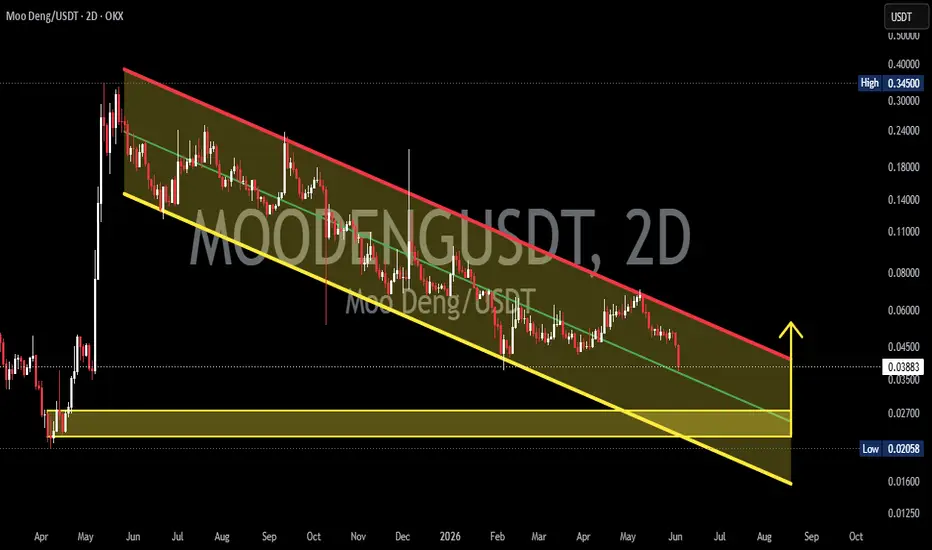
On this 2D chart, MOODENG/USDT is still trading within a Descending Channel that has been forming since its peak in mid-2025. This structure indicates that the medium- to long-term trend remains dominated by bearish pressure 📉, characterized by a consistent series of Lower Highs (LH) and Lower Lows (LL).
📍 The price is currently approaching a strong demand area highlighted by the yellow zone between $0.0275 and $0.0225. This area serves as a crucial support level, as it has previously acted as a significant reaction zone multiple times.
📌 Technically, the current price is trading near the lower boundary of the channel, creating the potential for a technical rebound if buyers step in and successfully defend this support area.
---
📉 Pattern Formation: Descending Channel
The primary pattern visible on this chart is a Descending Channel.
🔍 Pattern Characteristics:
✅ Price is moving between two parallel downward-sloping trendlines.
🔴 The upper trendline (red line) acts as dynamic resistance.
🟡 The lower trendline (yellow line) acts as dynamic support.
📉 As long as the price remains inside the channel, the primary trend remains bearish.
🚀 A breakout above the channel often signals the beginning of a stronger trend reversal.
📊 The chart shows multiple successful reactions from both the support and resistance boundaries, confirming the validity of the pattern.
---
🟢 Bullish Scenario
🚀 Scenario 1: Rebound from the Demand Zone
If the $0.0275 – $0.0225 demand zone is successfully defended by buyers:
🎯 Initial Target:
- $0.0450
🎯 Mid-Term Target:
- $0.0550
🎯 Main Target:
- $0.0650 – $0.0750
📈 These targets align with the channel resistance area, which currently serves as the upper boundary of price movement.
🚀 Scenario 2: Descending Channel Breakout
If price breaks above the channel resistance and closes decisively above it:
🔥 The bearish structure may come to an end.
🚀 Bullish momentum could increase significantly.
💰 Potential upside targets:
- $0.0900
- $0.1200
- $0.1500+
📊 The stronger the volume during the breakout, the higher the probability of a medium-term trend reversal.
---
🔴 Bearish Scenario
⚠️ The $0.0275 – $0.0225 area represents a critical final support zone.
If price loses this zone:
❌ The Descending Channel remains fully valid.
📉 Selling pressure may intensify.
🔻 Price could establish a new Lower Low.
🎯 Potential support levels below:
- $0.0200
- $0.0180
- $0.0150
⚠️ A breakdown below the demand zone would signal that sellers remain in control and that the downtrend is not yet complete.
---
🔍 Conclusion
📌 MOODENG/USDT is currently at a critical stage as price tests the major demand zone between $0.0275 and $0.0225, located near the lower boundary of the Descending Channel.
🟢 As long as this area holds, the possibility of a rebound toward the channel resistance remains open.
🔴 However, if support breaks, the risk of further downside increases and the bearish structure will continue to dominate.
⚖️ This demand zone can be viewed as a key decision point that may determine MOODENG's next major direction over the coming weeks and months.
💡 In other words, the current area represents a decision zone that could determine whether MOODENG begins a recovery phase or continues its long-term downtrend.
#MOODENG #MOODENGUSDT #Crypto #Altcoin #TradingView #TechnicalAnalysis #PriceAction #DescendingChannel #BullishReversal #BearishTrend #SupportAndResistance #CryptoTrading #ChartAnalysis #AltcoinSeason #MarketStructure #SwingTrading #Breakout #DemandZone #TrendAnalysis #CryptoMarket 🚀📈🔥

✅ Get Free Signals! Join Our Telegram Channel Here: t.me/TheCryptoNuclear
✅ Twitter: twitter.com/crypto_nuclear
✅ Join Bybit : partner.bybit.com/b/nuclearvip
✅ Benefits : Lifetime Trading Fee Discount -50%
✅ Twitter: twitter.com/crypto_nuclear
✅ Join Bybit : partner.bybit.com/b/nuclearvip
✅ Benefits : Lifetime Trading Fee Discount -50%
Disclaimer
The information and publications are not meant to be, and do not constitute, financial, investment, trading, or other types of advice or recommendations supplied or endorsed by TradingView. Read more in the Terms of Use.