NAS100: Threshold Analysis & Decision Framework | November 12
Reference Point: 25,625 | 08:45 UTC+4
MARKET PREMISE
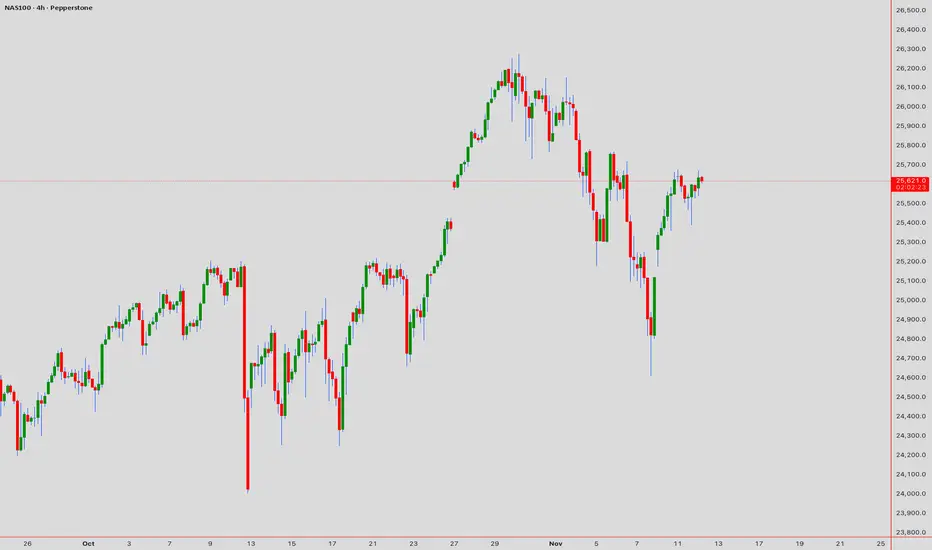
The Nasdaq 100 has stabilized within a confined bandwidth, presenting traders with a defined set of bifurcated outcomes. The micro-structure reveals a market in the midst of accumulation, where directional bias remains contested between competing institutional flows.
TECHNICAL ASSESSMENT MATRIX
Primary Trend (Dow Theory Lens): Uptrend remains intact; lower-bound support at 25,500 preserves bullish structure. Failure to maintain this floor signals potential regime shift.
Pattern Development: A Symmetrical Triangle is in formation across the 1H/4H timeframes. Contraction suggests breakout imminent—directional confirmation required.
Elliott Wave Interpretation: Wave IV consolidation underway. Upon completion, Wave V upleg anticipated toward fresh resistance territories.
Harmonic Configuration: Potential bearish Bat pattern exists if price recedes; conversely, completion of bullish Crab pattern supports upside continuation above 25,750.
INDICATOR CONFLUENCE TABLE
| Indicator | Timeframe | Status | Signal |
|-----------|-----------|--------|--------|
| Ichimoku Kumo | 4H | Price-Kumo Contact | Neutral-to-Bullish |
| RSI(14) | 4H | ~50 Median | Energy Stored |
| VWAP Proximity | Intraday | At Fair Value | Equilibrium |
| EMA(50) Stack | 1H | Bullish Alignment | Support Intact |
| Bollinger Squeeze | 30M | Band Tightening | Volatility Expansion Pending |
OPERATIONAL TRADE MATRIX
Bullish Engagement (Primary):
- Activation: Hourly close above 25,700 (Triangle apex breakout)
- Entry Coordination: 25,720–25,750
- Protective Stop: 25,580
- Profit Sequencing: 25,900 (T1) → 26,150 (T2)
- Risk-Reward Ratio: 1:2.4
Bearish Contingency (Secondary):
- Activation: Sustained close below 25,500 (Foundation breach)
- Entry Coordination: 25,480–25,450
- Protective Stop: 25,650
- Profit Sequencing: 25,250 (T1) → 25,000 (T2)
- Risk-Reward Ratio: 1:1.8
GANN TEMPORAL OVERLAY
Key cyclical windows on the 4D chart suggest consolidation resolution within the 12–15 hour window. Volume profile at the 25,650 level indicates potential liquidity pool; breakouts through this zone warrant heightened position management.
TRADE DIRECTIVE:
Reference Point: 25,625 | 08:45 UTC+4
MARKET PREMISE
The Nasdaq 100 has stabilized within a confined bandwidth, presenting traders with a defined set of bifurcated outcomes. The micro-structure reveals a market in the midst of accumulation, where directional bias remains contested between competing institutional flows.
TECHNICAL ASSESSMENT MATRIX
Primary Trend (Dow Theory Lens): Uptrend remains intact; lower-bound support at 25,500 preserves bullish structure. Failure to maintain this floor signals potential regime shift.
Pattern Development: A Symmetrical Triangle is in formation across the 1H/4H timeframes. Contraction suggests breakout imminent—directional confirmation required.
Elliott Wave Interpretation: Wave IV consolidation underway. Upon completion, Wave V upleg anticipated toward fresh resistance territories.
Harmonic Configuration: Potential bearish Bat pattern exists if price recedes; conversely, completion of bullish Crab pattern supports upside continuation above 25,750.
INDICATOR CONFLUENCE TABLE
| Indicator | Timeframe | Status | Signal |
|-----------|-----------|--------|--------|
| Ichimoku Kumo | 4H | Price-Kumo Contact | Neutral-to-Bullish |
| RSI(14) | 4H | ~50 Median | Energy Stored |
| VWAP Proximity | Intraday | At Fair Value | Equilibrium |
| EMA(50) Stack | 1H | Bullish Alignment | Support Intact |
| Bollinger Squeeze | 30M | Band Tightening | Volatility Expansion Pending |
OPERATIONAL TRADE MATRIX
Bullish Engagement (Primary):
- Activation: Hourly close above 25,700 (Triangle apex breakout)
- Entry Coordination: 25,720–25,750
- Protective Stop: 25,580
- Profit Sequencing: 25,900 (T1) → 26,150 (T2)
- Risk-Reward Ratio: 1:2.4
Bearish Contingency (Secondary):
- Activation: Sustained close below 25,500 (Foundation breach)
- Entry Coordination: 25,480–25,450
- Protective Stop: 25,650
- Profit Sequencing: 25,250 (T1) → 25,000 (T2)
- Risk-Reward Ratio: 1:1.8
GANN TEMPORAL OVERLAY
Key cyclical windows on the 4D chart suggest consolidation resolution within the 12–15 hour window. Volume profile at the 25,650 level indicates potential liquidity pool; breakouts through this zone warrant heightened position management.
TRADE DIRECTIVE:
Await breakout confirmation with concurrent volume expansion. Triangle compression suggests potential catalytic move. Disciplined position-sizing essential given binary outcome structure.
I am nothing @shunya.trade
Disclaimer
The information and publications are not meant to be, and do not constitute, financial, investment, trading, or other types of advice or recommendations supplied or endorsed by TradingView. Read more in the Terms of Use.
I am nothing @shunya.trade
Disclaimer
The information and publications are not meant to be, and do not constitute, financial, investment, trading, or other types of advice or recommendations supplied or endorsed by TradingView. Read more in the Terms of Use.