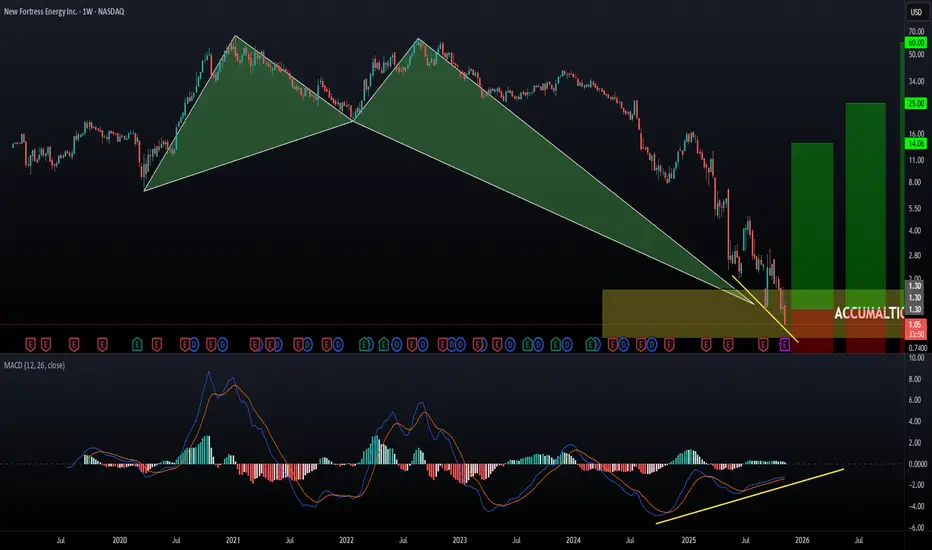
I’ve charted this ticker before and the setup didn’t play out, but this time the structure looks a lot more convincing. We’re at a point where the stock is likely gearing up for a major move — either a full breakdown or a sharp upside reversal. From a risk-management standpoint, a small allocation (e.g., ~1% of a diversified portfolio) could make sense for those who understand the volatility, but that’s strictly a general observation, not advice.
The good news: price action looks like it’s forming a potential bottom. On the log chart, I’m seeing a possible crab harmonic completion lining up with the end of a Wave C, backed by weekly MACD divergence. I’ve outlined the levels I’m watching — entry zone, stop-loss region, and upside targets — strictly as charting reference points.
Not financial advice — just sharing the setup as I see it on the charts.

Disclaimer
The information and publications are not meant to be, and do not constitute, financial, investment, trading, or other types of advice or recommendations supplied or endorsed by TradingView. Read more in the Terms of Use.
Disclaimer
The information and publications are not meant to be, and do not constitute, financial, investment, trading, or other types of advice or recommendations supplied or endorsed by TradingView. Read more in the Terms of Use.