Ticker: NFLX (Netflix, Inc.)
Timeframe: 2-hour
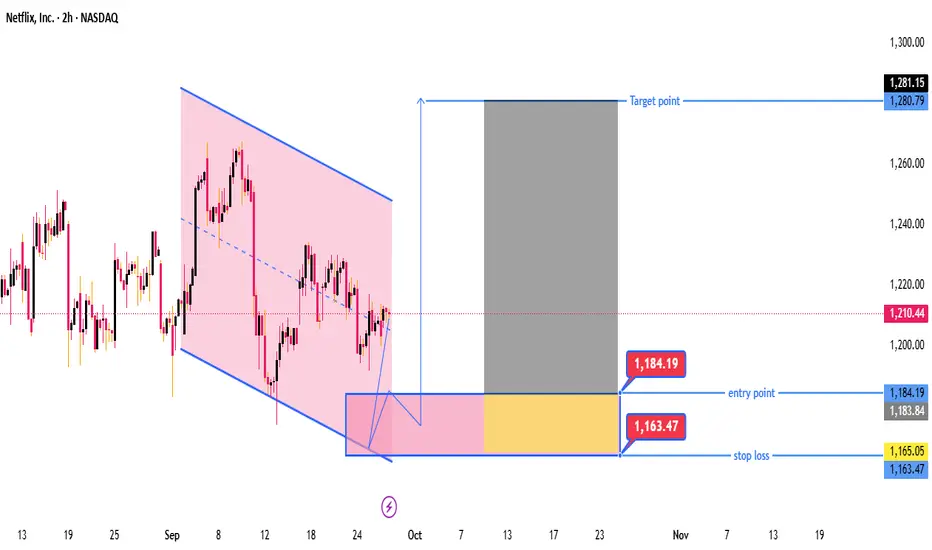
Current Price: $1,210.44
Trend: Price was moving in a downward channel (pink shaded area), but there's a potential breakout forming to the upside.
📉 Pattern Recognition
A falling channel is drawn (marked in pink).
The price appears to have broken out of this falling channel or is testing the breakout.
A bullish reversal is suggested, as there's a highlighted buy zone below the current price.
💡 Trade Setup
Element Value Description
Entry Point $1,184.19 Suggested buy zone
Stop Loss $1,163.47 Risk management level
Target Point $1,281.15 Projected upside target
🟨 Entry Zone
The blue box around $1,184.19 represents a demand zone (possible retracement buy area).
Yellow shaded area = refined zone of interest for buyers.
🟥 Stop Loss Zone
Stop loss below the demand zone, set at $1,163.47 (just below support structure).
Provides cushion against false breakouts.
🟦 Target Zone
Projected target at $1,281.15, aligned with previous resistance or measured move.
Expecting a trend continuation after the breakout.
⚖️ Risk-to-Reward Ratio (RRR)
Entry: $1,184.19
Stop: $1,163.47
Target: $1,281.15
Risk: $1,184.19 - $1,163.47 = $20.72
Reward: $1,281.15 - $1,184.19 = $96.96
📈 RRR ≈ 4.68:1 — very favorable.
🧠 Conclusion
This chart suggests a bullish breakout trade setup on Netflix.
The trade is designed to capitalize on the breakout from a downward channel.
High risk-to-reward setup.
Wait for price action confirmation in the entry zone before initiating a trade.
Watch for volume and overall market sentiment to confirm the breakout strength.
Timeframe: 2-hour
Current Price: $1,210.44
Trend: Price was moving in a downward channel (pink shaded area), but there's a potential breakout forming to the upside.
📉 Pattern Recognition
A falling channel is drawn (marked in pink).
The price appears to have broken out of this falling channel or is testing the breakout.
A bullish reversal is suggested, as there's a highlighted buy zone below the current price.
💡 Trade Setup
Element Value Description
Entry Point $1,184.19 Suggested buy zone
Stop Loss $1,163.47 Risk management level
Target Point $1,281.15 Projected upside target
🟨 Entry Zone
The blue box around $1,184.19 represents a demand zone (possible retracement buy area).
Yellow shaded area = refined zone of interest for buyers.
🟥 Stop Loss Zone
Stop loss below the demand zone, set at $1,163.47 (just below support structure).
Provides cushion against false breakouts.
🟦 Target Zone
Projected target at $1,281.15, aligned with previous resistance or measured move.
Expecting a trend continuation after the breakout.
⚖️ Risk-to-Reward Ratio (RRR)
Entry: $1,184.19
Stop: $1,163.47
Target: $1,281.15
Risk: $1,184.19 - $1,163.47 = $20.72
Reward: $1,281.15 - $1,184.19 = $96.96
📈 RRR ≈ 4.68:1 — very favorable.
🧠 Conclusion
This chart suggests a bullish breakout trade setup on Netflix.
The trade is designed to capitalize on the breakout from a downward channel.
High risk-to-reward setup.
Wait for price action confirmation in the entry zone before initiating a trade.
Watch for volume and overall market sentiment to confirm the breakout strength.
join my telegram channel t.me/goldmitalteam
t.me/goldmitalteam
t.me/goldmitalteam
Disclaimer
The information and publications are not meant to be, and do not constitute, financial, investment, trading, or other types of advice or recommendations supplied or endorsed by TradingView. Read more in the Terms of Use.