Please refer to these levels for Trend guidance.
Once you are familiar with them, transition to hourly charts for decision-making.
Once you are familiar with them, transition to hourly charts for decision-making.
Trade active
Second Week Summary:Observation:
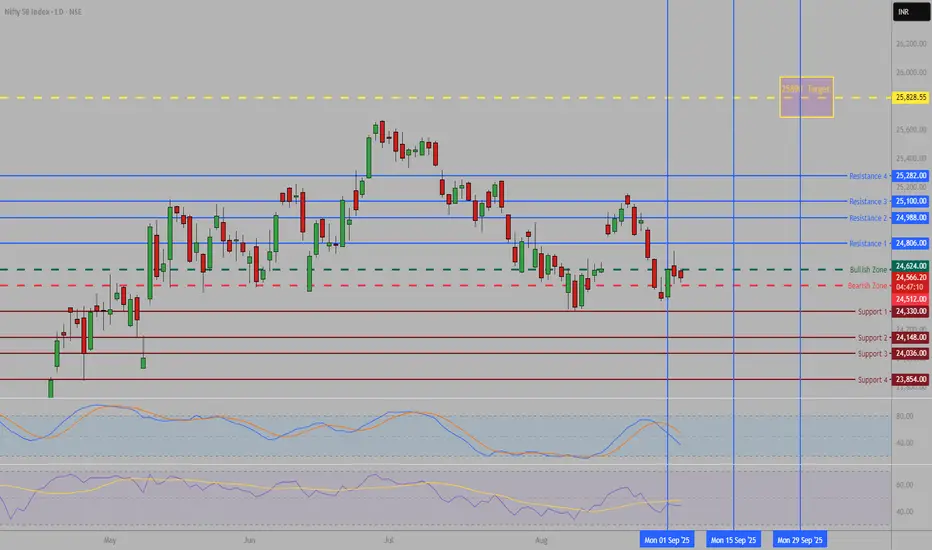
The week demonstrated the Nifty index progressively overcoming resistance levels, ultimately closing at its weekly high. This upward movement contributed to the recovery of the broader market, with numerous stocks crossing above their respective 50-day moving averages. The timing cycle indicated that Nifty started the week at a low point and concluded at its highest level.
Market Participants:
Bullish Perspective:
With the prevailing positive momentum intact, the level of 25,280 could serve as a target for profit realization. Given the recent market corrections over the past few months, a cautious approach is advisable. Investors are encouraged to realize gains in overbought zones and shift focus to stocks that have surpassed their 50-day moving averages and are poised for further gains. Maintain this strategy as long as the index remains above 25,100. If the index declines below this level, wait for it to approach its 20 or 50-day moving averages before re-entering positions.
Bearish Perspective:
Attention should be given to Monday’s closing and Tuesday’s market movements, as these may indicate a potential peak around September 15. Indicators suggesting overbought conditions could signal a forthcoming downtrend. Weaker stocks that have retraced only 50% of their previous swings may be considered for short positions, with profits realized at their swing lows.
Conclusion:
The initial phase of the recent upward movement appears complete. The next phase could either propel Nifty toward a target of 25,900 or lead to an intermediate correction, potentially stabilizing around the 50-day moving average at 24,900. Monitoring key levels will be essential in guiding investment decisions and avoiding potential traps.
Additionally, it is recommended to review the weekly analysis reports regularly, as they offer valuable insights and timely guidance aligned with current market conditions.
Trade closed: target reached
Third Week Summary:Observation:
The strong upward movement initiated on September 1 continued into the third week. The market has met all expected targets and closed above the R4 level of 25,282. Originally anticipated as a corrective wave C, the rally transitioned into a wave 3 advance, altering the overall market setup. It remains to be seen whether the rally will undergo a correction at this juncture before resuming toward higher targets, potentially reaching 25,890.
Market Participants:
Bullish Perspective:
Monitor the RSI indicator; as long as it remains above 60, it is advisable to maintain positions in stocks demonstrating their first breakouts after a minimum of six days of consolidation. This strategy allows for minimal loss in the event of a trend reversal. Trend indicators, being lagging in nature, should be approached with caution.
Bearish Perspective:
Given the anticipated gap-down opening on Monday, caution is advised for bearish entries, as the market may open lower and exhibit intra-day bullish recovery. However, if the RSI falls below 60, there may be opportunities to position for a target around 25,100. Timing will be crucial, but there exists potential for bears to take advantage of the movement.
Conclusion:
The initial phase of the recent upward trend appears to be complete. A corrective phase is expected, likely stabilizing around the 20- to 50-day moving averages near 25,000, aligning with the 50% retracement level.
Regular review of the weekly analysis reports is recommended, as they provide valuable insights and timely guidance aligned with prevailing market conditions.
Note
FOURTH WEEK SUMMARY:The relentless surge of 1000 points in September finally came to a thunderous halt on September 18th at 25,450, leaving only a modest gain of 250 points by last Friday’s close.
What was once a roaring 14-day ascent now faces a 7-day retreat—a stark reminder of the market’s volatile heartbeat. The wave pattern has once again shifted into an ABC formation, signaling that this turbulent force has the power to shatter the 200-day moving average at 24,450, with the potential to push even lower to 24,117 and perhaps down to 23,233.
Market Participants:
**Bullish Viewpoint:**
A close below 24,600 should serve as a warning—an alarm bell to stay far away. Right now, there are no signals favoring the bulls; no opportunities beckon. It's a time to be patient—wait and watch as this chaos unfolds, resisting the urge to jump prematurely into the fray. Let the storm pass, only then can clarity emerge.
**Bearish Viewpoint:**
For the bears, this is a moment of strategic opportunity. Pullbacks, breaks below key moving averages, and support levels are your signals to strike.
Around 24,100, take profits and pause—because from here, the market could either rally back to the 200 DMA or plunge further to 23,800, retracing to 50% of the six-month rally
**Conclusion:**
This isn't a time for the everyday trader to gamble blindly. Only the seasoned, skilled professionals armed with proven tools and deep understanding should dare to participate.
The month of October will wield the power to shape the unfolding six-month market saga, as per GANN analysis.
This phase isn’t just about indices—it’s reflected in individual stocks, too. Choose your battles wisely, for the wrong move could leave you stranded in the storm for half a year.
Regular review of the weekly analysis reports is recommended, as they provide valuable insights and timely guidance aligned with prevailing market conditions.
Disclaimer
The information and publications are not meant to be, and do not constitute, financial, investment, trading, or other types of advice or recommendations supplied or endorsed by TradingView. Read more in the Terms of Use.
Disclaimer
The information and publications are not meant to be, and do not constitute, financial, investment, trading, or other types of advice or recommendations supplied or endorsed by TradingView. Read more in the Terms of Use.