
In the global theater of financial markets, many retail traders feel like protagonists in a psychological thriller. You identify a pristine support level, set your stop loss with surgical precision, and wait.
Suddenly, a violent candle "hunts" your level, triggers your exit, and—as if by magic—the market reverses and rallies in your original direction.
You feel watched. You feel targeted by "Operators."
This is not a conspiracy; it is the Sovereign Reality of Liquidity.
1. The Institutional Paradox: The "Big Fish" Problem
To understand why you are being hunted, you must understand the Inertia of Size.
Imagine a massive Institution (FII) attempting to deploy huge capital. They are like a Blue Whale in a shallow pond.
The Constraint: If they execute a market order, they will exhaust all available sellers and drive the price up against themselves (Slippage).
The Requirement: To enter a massive LONG position without slippage, they require an equally massive pool of Sell Orders at a specific price.
The Trap:
Your Stop Loss (on a Long position) is technically a Sell Market Order.
When thousands of retail traders place their stops at a predictable level, they create a Liquidity Cluster.
The Big Players don’t "see" your account; they see a concentrated pool of liquidity. They utilize algorithmic precision to drive price into that pool, "harvesting" your sell orders to fill their massive buy orders at a wholesale price.
2. The Analogy: The Fragile Crust
Think of Market Structure like a Pie or Samosa.
The "Support Level" is the golden, crispy crust. It appears solid.
But for the Smart Money, the crust is merely an obstacle to the filling (The Liquidity) inside.
They must break the crust (trigger the stops) to access the liquidity that fuels their move. Once the crust is shattered and the liquidity is absorbed, the shell is discarded, and the market rallies.
3. Engineering Your Edge
To evolve from "Retail Prey" to "Institutional Aligned," you must stop trading the lines and start trading the volume.
A. The Ceiling (High Volume Node) When price approaches a massive volume shelf from below, do not buy the breakout immediately. The trapped buyers from the past will sell to exit at breakeven. This is often a Shorting Zone.
B. The Floor (Liquidity Trap) When price drops into a historical volume cluster, do not panic sell.
The Professional Reaction: Wait for the "Crust" break (a dip below the level to hunt stops).
The Trigger: Watch for a strong 1-hour candle close back ABOVE the level. This is the Swing Failure Pattern (SFP).
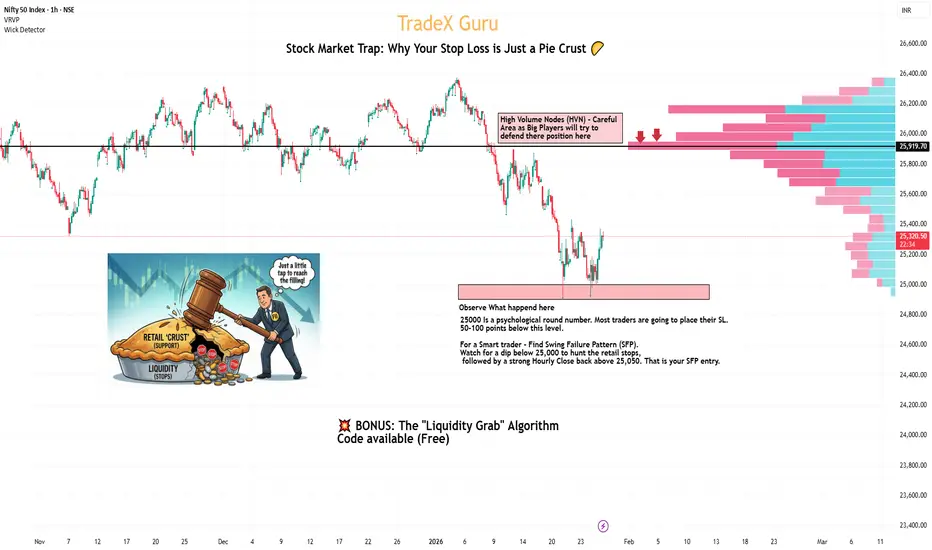
🏛 Case Study: Nifty 50 Index
(Please refer to the chart image above)
We can see this mechanic playing out live on the Nifty 50:
The Operator's Fortress: Note the massive Volume Shelf (HVN) at the top. This acts as a supply zone.
The Psychological Level (25,000): This is a round number where most retail stops are hiding.
The Plan: We do not blind buy 25,000. We wait for the "Stop Hunt" into the 24,900 zone, followed by a sharp reclamation. That is the Institutional Entry.
💻 BONUS: The "Wick Detector" Script (Free)
I have written a custom Pine Script tool for the TradeX Guru community. This tool automatically highlights candles that "break the crust" (long lower wicks) and reject price.
Pine Script®
The Math: It measures the lower wick (the tail) of every candle.
The Trigger: If the lower wick is larger than 50% of the total candle size, it prints a Teal Diamond (💎) below that candle.
How to Learn Trade With It (The Strategy)
Do not buy every diamond you see. Use this 3-step filter:
Step 1: Check the Location (Context) Only look at the Diamond if it appears at a Key Level:
Is price at a strong Support zone?
Is price near a round number (like 25,000 on Nifty)?
If a diamond appears in the middle of nowhere, ignore it.
Step 2: The Signal
Wait for the candle with the Teal Diamond to close.
This confirms the "Stop Hunt" is finished. The "Whale" has absorbed the sellers.
Step 3: The Entry & Stop Loss
Entry: Buy on the next candle if it stays above the diamond candle's low.
Stop Loss: Place your SL just below the Low of the diamond candle. (If price breaks this low, the setup failed).
The Meaning: A long lower wick means sellers tried to push the price down (breaking the crust), but buyers aggressively pushed it back up. This is a classic Liquidity Grab.
The Axiom: The market is not a charitable organization. It is an efficiency engine designed to transfer capital from the Impatient to the Disciplined.
Disclaimer: This analysis is for educational purposes only and does not constitute financial advice. Trading involves significant risk.
Suddenly, a violent candle "hunts" your level, triggers your exit, and—as if by magic—the market reverses and rallies in your original direction.
You feel watched. You feel targeted by "Operators."
This is not a conspiracy; it is the Sovereign Reality of Liquidity.
1. The Institutional Paradox: The "Big Fish" Problem
To understand why you are being hunted, you must understand the Inertia of Size.
Imagine a massive Institution (FII) attempting to deploy huge capital. They are like a Blue Whale in a shallow pond.
The Constraint: If they execute a market order, they will exhaust all available sellers and drive the price up against themselves (Slippage).
The Requirement: To enter a massive LONG position without slippage, they require an equally massive pool of Sell Orders at a specific price.
The Trap:
Your Stop Loss (on a Long position) is technically a Sell Market Order.
When thousands of retail traders place their stops at a predictable level, they create a Liquidity Cluster.
The Big Players don’t "see" your account; they see a concentrated pool of liquidity. They utilize algorithmic precision to drive price into that pool, "harvesting" your sell orders to fill their massive buy orders at a wholesale price.
2. The Analogy: The Fragile Crust
Think of Market Structure like a Pie or Samosa.
The "Support Level" is the golden, crispy crust. It appears solid.
But for the Smart Money, the crust is merely an obstacle to the filling (The Liquidity) inside.
They must break the crust (trigger the stops) to access the liquidity that fuels their move. Once the crust is shattered and the liquidity is absorbed, the shell is discarded, and the market rallies.
3. Engineering Your Edge
To evolve from "Retail Prey" to "Institutional Aligned," you must stop trading the lines and start trading the volume.
A. The Ceiling (High Volume Node) When price approaches a massive volume shelf from below, do not buy the breakout immediately. The trapped buyers from the past will sell to exit at breakeven. This is often a Shorting Zone.
B. The Floor (Liquidity Trap) When price drops into a historical volume cluster, do not panic sell.
The Professional Reaction: Wait for the "Crust" break (a dip below the level to hunt stops).
The Trigger: Watch for a strong 1-hour candle close back ABOVE the level. This is the Swing Failure Pattern (SFP).
🏛 Case Study: Nifty 50 Index
(Please refer to the chart image above)
We can see this mechanic playing out live on the Nifty 50:
The Operator's Fortress: Note the massive Volume Shelf (HVN) at the top. This acts as a supply zone.
The Psychological Level (25,000): This is a round number where most retail stops are hiding.
The Plan: We do not blind buy 25,000. We wait for the "Stop Hunt" into the 24,900 zone, followed by a sharp reclamation. That is the Institutional Entry.
💻 BONUS: The "Wick Detector" Script (Free)
I have written a custom Pine Script tool for the TradeX Guru community. This tool automatically highlights candles that "break the crust" (long lower wicks) and reject price.
The Math: It measures the lower wick (the tail) of every candle.
The Trigger: If the lower wick is larger than 50% of the total candle size, it prints a Teal Diamond (💎) below that candle.
How to Learn Trade With It (The Strategy)
Do not buy every diamond you see. Use this 3-step filter:
Step 1: Check the Location (Context) Only look at the Diamond if it appears at a Key Level:
Is price at a strong Support zone?
Is price near a round number (like 25,000 on Nifty)?
If a diamond appears in the middle of nowhere, ignore it.
Step 2: The Signal
Wait for the candle with the Teal Diamond to close.
This confirms the "Stop Hunt" is finished. The "Whale" has absorbed the sellers.
Step 3: The Entry & Stop Loss
Entry: Buy on the next candle if it stays above the diamond candle's low.
Stop Loss: Place your SL just below the Low of the diamond candle. (If price breaks this low, the setup failed).
The Meaning: A long lower wick means sellers tried to push the price down (breaking the crust), but buyers aggressively pushed it back up. This is a classic Liquidity Grab.
The Axiom: The market is not a charitable organization. It is an efficiency engine designed to transfer capital from the Impatient to the Disciplined.
Disclaimer: This analysis is for educational purposes only and does not constitute financial advice. Trading involves significant risk.

TradeX Guru | Institutional Scalping Systems 🛡️ 🚀 Get Full Access & Join Our Community: [Whop Store]whop.com/txg-indicator/
[Superprofile Bio]superprofile.bio/vp/tradex-guru-indicator 📩 Contact: tradexguru1@gmail.com
tradexguru.in
[Superprofile Bio]superprofile.bio/vp/tradex-guru-indicator 📩 Contact: tradexguru1@gmail.com
tradexguru.in
Related publications
Disclaimer
The information and publications are not meant to be, and do not constitute, financial, investment, trading, or other types of advice or recommendations supplied or endorsed by TradingView. Read more in the Terms of Use.