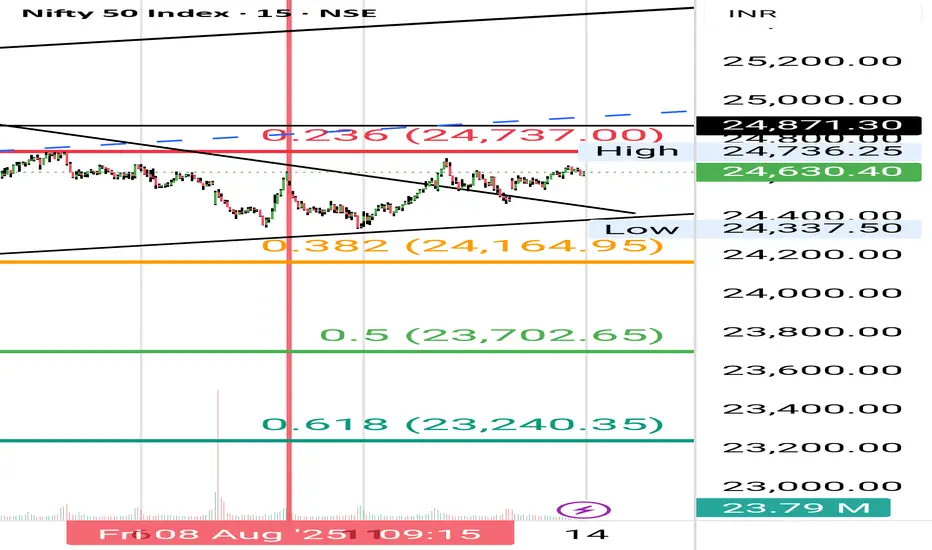
The Nifty 50 is currently consolidating within a well-defined range of 24,300 (support) to 24,700 (resistance). This compression zone is backed by strong Open Interest clustering on both Call and Put sides, suggesting a potential breakout setup. My idea focuses on visualizing this range with floating entry labels, CE/PE overlays, and mutually exclusive signal logic to guide intraday decisions.
---
🔍 Technical Setup
| Parameter | Value / Observation |
|----------------------|------------------------------------------------|
| Support Zone | 24,300–24,400 |
| Resistance Zone | 24,700–24,740 |
| Daily RSI | Positive crossover, holding above 50 |
| Candlestick Signal | Inverted hammer + long upper shadows |
| OI Clustering | Highest Call & Put OI at 24,500 |
| EMA Structure | Price hovering near 10-day and 50-day EMA |
Bullish Breakout Plan
- Trigger: Sustained close above 24,740
- Target Zones: 24,900 → 25,200
- Entry Label: Floating CE overlay with momentum confirmation
- Stop-loss: Below 24,480
🔸 Bearish Breakdown Plan
- Trigger: Breach below 24,300
- Target Zones: 24,100 → 23,950
- Entry Label: PE overlay with RSI divergence confirmation
- Stop-loss: Above 24,450
Disclaimer
The information and publications are not meant to be, and do not constitute, financial, investment, trading, or other types of advice or recommendations supplied or endorsed by TradingView. Read more in the Terms of Use.
Disclaimer
The information and publications are not meant to be, and do not constitute, financial, investment, trading, or other types of advice or recommendations supplied or endorsed by TradingView. Read more in the Terms of Use.