
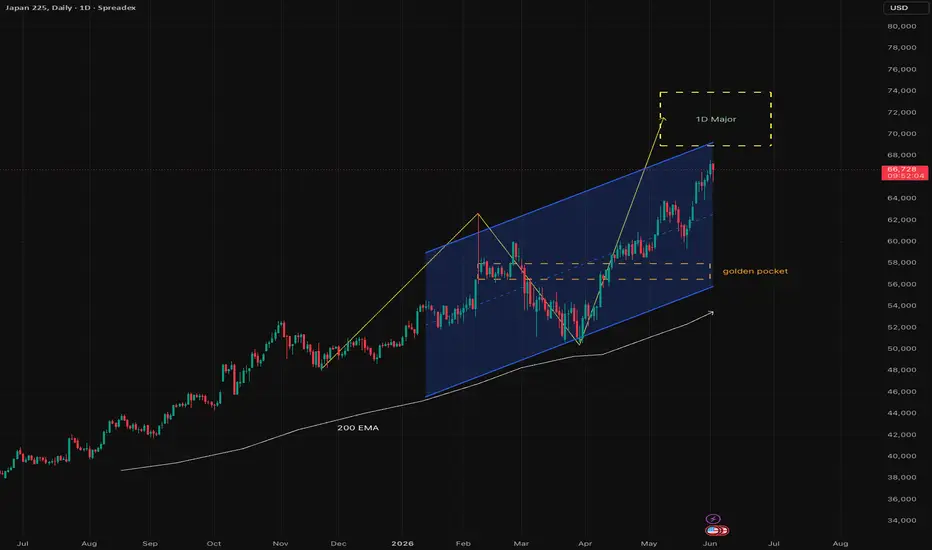
As seen, the Japan 225 (Daily) is displaying a stellar textbook bullish market structure. After a healthy multi-month consolidation pattern (yellow zig-zag corrective wave) that completed in late March near the $50,000 macro support line, the index experienced a massive impulsive continuation.
Price has cleanly broken above the previous local resistance levels ($58,000 and $62,400), effectively flipping the entire zone into a strong demand foundation. It is currently moving aggressively higher within a broad ascending structural channel (solid blue lines).
Key Technical Catalysts
Impeccable Macro Trend: The price is trading safely above the 200 EMA (white line), which continues to slope steadily upward, confirming strong macro-bullish institutional backflow.
Resistance Turned Support: The old consolidation ceiling around $62,400 has been completely cleared and successfully retested, establishing a rock-solid higher low structure.
Ascending Channel Geometry: Price is currently advancing towards the upper boundary of its dominant ascending channel. A minor short-term pause or shallow intraday retest of the local $65,500 zone (yellow horizontal line segment) would be a completely healthy development before the next leg up.
Overbought Extensions: The dashboard indicates that while the overarched trend momentum is entirely bullish, short-term oscillators are pushing into overbought territory. This signals that while the upside is heavily favored, chasing entries at the exact current peak ($66,808) carries higher short-term risk than waiting for minor intraday cool-offs.
Trading Scenarios & Execution
🔵 Long Entry Strategy (Trend Continuation)
Optimal Entry Area: Look for long entries on minor pullbacks towards $65,000 - $65,500 or upon a clean structural bull-flag breakout on lower timeframes.
Stop Loss: A daily close below the $62,000 support level invalidates the immediate aggressive upside momentum.
Target Zones:
Target 1: $69,000 (Psychological milestone and channel mid-line junction).
Target 2 (Primary Macro Goal): $71,000 - $73,500 (The highlighted yellow target box marked as [1D] Major, which aligns perfectly with macro-extension measurements).
🔴 Potential Short Strategy (The Correction Scenario)
Thesis: Should the market begin to correct—either just before or right after hitting the major [1D] Major target zone—we anticipate a deeper, healthy macro retracement.
Execution & Outlook: This potential short scenario targets a pullback into the Golden Pocket (the 0.618 - 0.65 Fibonacci retracement level of the entire impulsive run). This area provides massive technical confluence, as the steadily climbing 200 EMA (white line) is expected to catch up and meet the price exactly within this Golden Pocket zone by the time the correction plays out. This would offer a textbook institutional reload zone for long-term buyers.
⚠️ Risk Management Notice
Disclaimer: This analysis is purely based on the chart structures presented and does not constitute financial advice. Global indices can experience sudden volatility shifts due to macroeconomic data releases. Trade with predefined stop losses and strict risk allocation.
What is your outlook on the Japanese market? Do you expect a direct run into the $70k handle, or will we see a deeper retest first? Let us know your view in the comments section! 👇

CH Invest and Trading
Disclaimer
The information and publications are not meant to be, and do not constitute, financial, investment, trading, or other types of advice or recommendations supplied or endorsed by TradingView. Read more in the Terms of Use.
CH Invest and Trading
Disclaimer
The information and publications are not meant to be, and do not constitute, financial, investment, trading, or other types of advice or recommendations supplied or endorsed by TradingView. Read more in the Terms of Use.