
RSI Beyond 70/30: Position, Structure, and Adaptive Zones
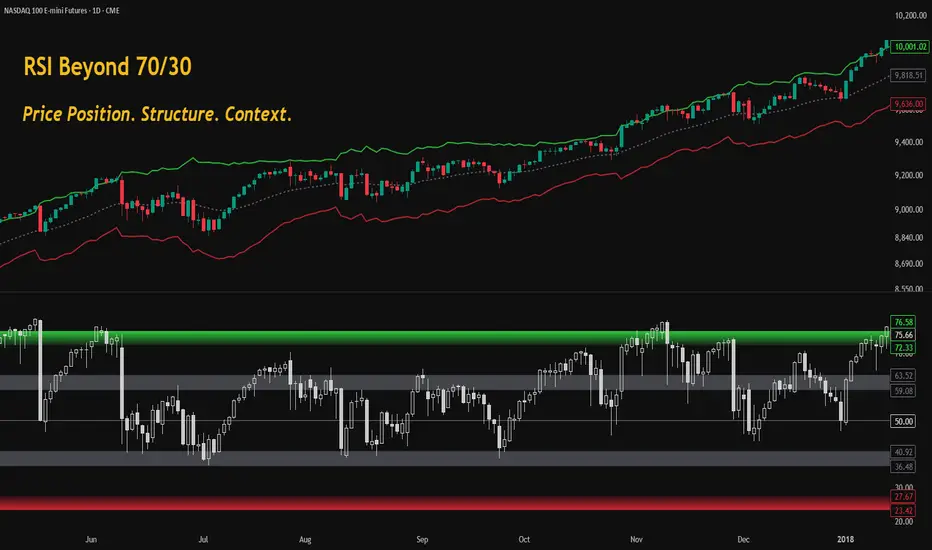
📘 RSI Beyond 70/30: The AdaptiveRSI Framework
0. What you already know
Most traders learn RSI as a line between 0 and 100, with 70 and 30 used as the classic overbought and oversold levels.
That is a useful starting point. But it also hides the main problem.
RSI(14) at 70 and RSI(2) at 70 are not the same signal, even though most RSI education treats them as if they were. The same RSI number can mean different things depending on length, scale, context, and time horizon.
This tutorial explains RSI through one core idea:
Once you see RSI this way, the indicator becomes more than a fixed 70/30 oscillator. It becomes a framework for reading price position, RSI structure, adaptive context, projected levels, different horizons, and extreme behavior.
📌 This is a long tutorial. You can skim the main ideas in a few minutes, but the full framework is meant to be studied, not consumed in one scroll.
---
1. A practical starting point
If you are new to AdaptiveRSI, start simple.
You do not need to use everything at once.
The easiest entry point is still RSI(14). The difference is that AdaptiveRSI gives that familiar scale a stronger structure.
---
2. RSI as price position
Most traders focus on 70 and 30.
The first RSI level to understand is actually 50.
When RSI equals 50, price is at its moving-average reference for the same length. When RSI moves above 50, price is positioned above that equilibrium. When RSI moves below 50, price is positioned below it.
That changes the way RSI can be read.
RSI is not only a momentum oscillator. It can also be interpreted as a normalized measure of price position around a moving-average equilibrium.

This is not only a visual shortcut. RSI can be derived from price position around its moving-average reference. The distance between price and that reference is normalized by recent movement and translated back into the familiar 0–100 RSI scale.
The RSI values remain the same as in the traditional formulation, but the interpretation becomes more concrete: RSI measures price position, not just momentum.

The full formula and implementation are available here: RSI: alternative derivation.
Once RSI is viewed as position, the classic 70/30 problem becomes easier to understand.
If 50 means equilibrium, then 70 means distance above equilibrium. But that distance cannot have the same meaning for every RSI length.
---
3. Why fixed 70/30 levels fail across RSI lengths
The classic 70/30 levels are simple, familiar, and useful as a first reference.
But they are not length-aware.
RSI(2), RSI(14), RSI(89), and RSI(200) do not behave the same way. Short RSI lengths move violently and touch extreme levels often. Long RSI lengths are much more compressed around 50 and may rarely reach 70 or 30 at all.
The number is the same. The event is not.
Below, you can see how RSI distributions change with lookback length.

This is the core weakness of a fixed RSI map.
RSI(2) at 70 may be routine. RSI(89) at 70 may be exceptional. Treating both as the same type of “overbought” signal removes important context.
A better approach is to compare RSI values in a standardized space first, then translate them back into practical RSI levels.
That is where the AdaptiveRSI framework begins.
Below, RSI values are normalized using Logit RSI logic. Instead of comparing raw numbers from the bounded 0–100 scale, RSI is transformed into standardized units of displacement.

A reading of +1σ is not a guaranteed trading signal. But it gives a common language for RSI displacement across different lengths.
Fixed 70/30 levels cannot do that.
---
4. RSI Adaptive Zones
Traders have been adjusting RSI interpretation for decades.
Andrew Cardwell noticed that RSI(14) often behaves differently in different market regimes, with uptrends often holding around 40–80 and downtrends around 20–60.
Connie Brown also moved RSI away from a simple mechanical 70/30 reading. She emphasized context, ranges, structure, and the way RSI behavior changes with the market environment.
Larry Connors approached the same problem from the opposite side. For very short-period RSI, he used much more extreme levels, such as 10/90, because RSI(2) behaves differently from the classic RSI(14).
John Hayden pointed toward another part of the same issue: RSI is nonlinear, especially near the edges of the 0–100 scale.
Traditional 60/40 & 80/20 thresholds on RSI(14):

These were not random disagreements about RSI.
They were signs that RSI interpretation was already adapting in practice.
Cardwell adjusted ranges. Brown emphasized context. Connors changed the levels for short-term RSI. Hayden pointed toward nonlinear behavior near extremes.
Different traders were solving different parts of the same structural problem:
Adaptive Zones try to connect that intuition into one consistent framework.
Instead of forcing every RSI length into the same 70/30 map, the zones are first defined as standardized distances in transformed RSI space. Then they are translated back into RSI values for the selected length.
That distinction matters.
The starting point is no longer an arbitrary round number on the 0–100 scale. The starting point is a consistent set of sigma landmarks.
That does not make 70 useless. It simply shows what 70 really is: one familiar point inside a broader standardized map.
The +1.53σ is not a special boundary in the Adaptive Zones framework. It is where the old round-number threshold lands after the logit transform and length-dependent scaling based on the 2/√(n−1) factor.
The full derivation is documented in the free RSI Manifesto.

This is the key point.
On the classic RSI scale, 70 looks important because it is a clean and familiar number. In standardized space, it becomes one point between other defined landmarks.
Adaptive Zones define the map in sigma space first, then translate that map back into RSI values for each length.
Adaptive Zone Summary
A boundary such as +1σ or +√3σ is adjusted for the selected RSI length and converted back from transformed space into the familiar 0–100 RSI scale.
That is why the zone values change with length, while the underlying map stays consistent.
Here is an example with RSI(14). The sigma landmarks are translated back into the familiar 0–100 RSI scale, so the framework can still be read on a normal RSI chart.
This is where the idea of “quantifying tradition” becomes practical. Levels such as 40/60, 30/70, or 20/80 no longer have to be treated only as hand-adjusted rules of thumb. They can be compared against a standardized map and understood as different degrees of RSI displacement.

RSI adaptive zones on RSI(14):

The full zones as a background for the RSI indicator look like this:

The same sigma boundary can correspond to different RSI values depending on the RSI length.
Look at the pictures below. Note the zone values displayed on the right scale: for short lookback RSIs, they are placed far from the 50-point line; for long lookbacks, they stay close to the middle because this is how RSI behaves.
RSI(2)

RSI(14)

RSI(200)

The examples above show how the same standardized boundaries translate into different RSI values depending on the selected length.
For quick reference, the table below shows Adaptive Zone levels for RSI lengths arranged in a Fibonacci-like progression. This makes it easier to see how the same standardized zones compress toward the 50-point line as the RSI lookback gets longer.
📌 RSI Zones Cheat Sheet

This reflects the natural behavior of RSI. Short RSI lengths move widely across the 0–100 scale, while longer RSI lengths stay much closer to the middle. Adaptive Zones make that compression visible instead of forcing every length into the same fixed 70/30 map.
Near the middle of the scale, RSI often describes balance, rotation, and consolidation around equilibrium. In support and resistance zones, RSI may show reactions, pullbacks, failed pushes, or repeated tests. In stronger trend zones, RSI can remain elevated or depressed for longer than a simple overbought or oversold interpretation would suggest.
Tail zones are different again. They describe abnormal extensions, exhaustion, panic, blow-off movement, or sharp reaction risk.
A practical way to read the zones is this:
Middle / equilibrium area: consolidation, rotation, noise, and mean reversion around the average.

Adaptive support / resistance zones: reactions, pullbacks, failed pushes, repeated tests, or breakouts that may signal a change in pressure.

Strong upper / lower trend zones: active directional pressure, trend continuation, and shallow pullbacks.

Tail / extreme zones: abnormal stretch, exhaustion, panic, blow-off movement, and sharp reaction risk. This is not an automatic reversal signal.

This is the main value of Adaptive Zones.
They keep the underlying statistical reference consistent, but translate it into RSI levels that make sense for the selected length.
The question becomes not only:
but:
---
5. One framework, five tools
AdaptiveRSI is built around one interpretation:
Each tool answers a different practical question, but all of them come from the same interpretation of RSI.
The goal is not to create a collection of unrelated indicators. The goal is to look at the same RSI framework from different angles: position, context, structure, price translation, time horizon, and standardization.
You do not need every tool on every chart.
The point is that they all describe the same RSI framework instead of treating each indicator as a separate trick.
---
6. From RSI line to RSI structure
Most traders display RSI as a line.
That is clean, but it shows mainly one value per bar: the closing RSI value.
Price can be displayed with open, high, low, and close. RSI can be displayed the same way.
RSI candles show where RSI opened, how far it stretched, how low it moved, and where it finally closed. This matters because many important RSI events happen inside the bar, not only at the close.
A wick into a zone, a failed push, or a strong close inside a zone can all carry different information.

This is where RSI starts to behave less like a simple oscillator and more like a structure.
A line shows the path of closing values. Candles show pressure, rejection, continuation, and exhaustion inside RSI movement.
RSI candles can be plotted using the RSI adaptive zones script.
---
7. RSI candles and zones together
RSI candles become more useful when they are read together with Adaptive Zones.
A line can show where RSI closed. A candle can show how RSI behaved while testing a zone.
A wick into adaptive resistance followed by a close below it is not the same as a strong close inside that zone. A quick rejection from a tail zone is not the same as several accepted closes near an extreme.
In consolidation, RSI candles may show repeated rejection from adaptive support and resistance areas. In a trend, they may show shallow pullbacks and continued closes inside strong zones. In tail areas, they may show whether an extreme was rejected quickly or accepted for several bars.

This is why RSI candles are not just a visual variation.
They reveal structure inside RSI movement, and that structure becomes more meaningful when it is placed inside length-aware zones.
---
8. The translation problem between RSI and price
The standard RSI layout creates a practical problem.
The signal usually lives in the lower panel, but the decision happens on the price chart.
A trader may see RSI approaching 70, 50, 30, or an adaptive zone, but still has to translate that information back into price levels.
If RSI represents price position, then RSI levels can also be projected onto price.
That is the idea behind RSI Chart Overlay. Instead of keeping RSI levels only in the lower panel, the same levels can be shown directly on the price chart, where the trader actually makes decisions.
60/40 point thresholds projected onto price:

70/30 point thresholds projected onto price:

This changes the workflow.
The trader no longer has to constantly look down at RSI and then back up at price. The oscillator remains useful, but the relevant RSI-derived levels become visible in the same space as price action.
---
9. RSI length as a hidden time horizon
RSI length is usually treated as just an input setting.
But it also represents a hidden time horizon.
Short lengths describe short-term movement. Longer lengths describe broader market behavior. This becomes clearer when we compare RSI across timeframes, because the same market horizon can be expressed in more than one way.
A weekly RSI(14) covers roughly 70 trading days. A daily RSI(70) covers a similar horizon, because 14 weeks times 5 trading days gives about 70 daily bars.
In that sense, weekly RSI(14) and daily RSI(70) are looking at a similar market window.
Weekly RSI(14) gives a new confirmed reading only after the weekly bar closes, usually on Friday. Daily RSI(70) follows a similar horizon, but it updates every day.
That means the trader can observe a broad, weekly-like RSI horizon with much higher update frequency.

But there is still a problem.
Daily RSI(70) does not behave on the same scale as the familiar RSI(14). It is usually much more compressed around 50, so its raw values cannot be interpreted with the same mental map.
If we want to compare horizons properly, we need to translate the reading first.
That is the purpose of Rescaled RSI.
First, the source RSI is transformed into standardized sigma units. Then those sigma readings are translated back into the selected RSI reference scale, usually the familiar RSI(14) scale and its Adaptive Zones.
This allows a longer-horizon RSI structure to be read through a scale that traders already understand.
For example: daily RSI(70) at 60 points maps to roughly 71.8 on the RSI(14) scale after rescaling. The raw value of 60 looks unremarkable on RSI(70), because long-period RSI stays compressed around 50. After rescaling, the same reading sits clearly above the breakout zone on the RSI(14) scale.

The goal is not to pretend that all RSI lengths are identical.
The goal is to make their interpretation comparable, so longer- and shorter-horizon RSI structure can be read inside one coherent framework.
---
10. Logit RSI as the mathematical bridge
Logit RSI is not only a tool for extreme readings.
Inside this framework, it is the mathematical bridge that makes standardization possible.
By transforming RSI out of the bounded 0–100 scale, different RSI lengths can be compared in standardized units before being translated back into adaptive RSI levels.
This also solves a practical problem near the extremes.
The classic RSI scale becomes compressed close to 0 and 100. RSI 97 and RSI 99 are only two points apart, even when the market behavior behind those readings can be very different.
Logit RSI gives that extreme behavior more room to be analyzed, especially for statistical research, short RSI lengths, and situations where the classic scale starts hiding the difference between extreme and more extreme.
RSI(2) gets compressed around 0 and 100 points:

Logit RSI(2) shows true overextensions:

For practical chart reading, RSI Adaptive Zones, RSI candles, and RSI Chart Overlay are usually easier entry points.
But Logit RSI is what allows the framework to connect bounded RSI values, standardized distances, adaptive zone levels, horizon rescaling, and extreme behavior inside one structure.
---
11. Putting it together
For almost five decades, traders have been adapting RSI interpretation in practice.
Cardwell adjusted the ranges. Brown emphasized context. Connors used much more extreme levels for short-period RSI. Hayden pointed toward nonlinear behavior near the edges of the scale.
Those approaches came from different trading styles, but they were circling the same issue:
AdaptiveRSI connects those observations into one framework built around a single interpretation: RSI as a normalized price position around a moving-average equilibrium.
The point is not to make RSI more complicated.
The point is to make RSI interpretation more consistent.
The same RSI value can mean different things depending on length, context, and horizon.
AdaptiveRSI is built to make that interpretation more visual, more consistent, and more structurally useful.
The full long-form explanation of the AdaptiveRSI framework, including the derivation, scaling logic, adaptive zones, and broader interpretation model, is available in the free 38-page RSI Manifesto.
---
12. Common questions
→ Does AdaptiveRSI replace classic RSI?
Not really. It changes the interpretation, not the indicator itself.
RSI(14) remains the most useful common reference because traders already understand it. AdaptiveRSI keeps that familiar scale, but adds structure around it: equilibrium, zones, candles, projected levels, horizon translation, and standardized extremes.
→ Is 70/30 wrong?
70/30 is not wrong. It is incomplete.
The problem begins when the same 70/30 map is applied to every RSI length as if RSI(2), RSI(14), and RSI(200) behaved the same way.
They do not.
A fixed threshold can be useful as a reference. It should not be treated as a universal interpretation system.
→ Are Adaptive Zones buy and sell signals?
No.
Adaptive Zones describe the RSI environment. They can show balance, support and resistance behavior, trend pressure, overbought or oversold pressure, and extreme tail conditions.
That information may support a trading decision, but it does not replace price action, trend context, risk management, or a complete strategy.
→ Why use sigma instead of just changing RSI levels by hand?
Manual levels can work, but they do not create one consistent map.
Sigma-based zones allow RSI interpretation to be defined in standardized space first and then translated back into practical RSI values for each length.
That is the difference between adjusting RSI by feel and using one framework across many RSI lengths.
→ Why is the 50 line so important?
Because it connects RSI directly to price equilibrium.
RSI(14) at 50 means price is at its 14-period moving average. Above 50, price is positioned above that balance. Below 50, price is positioned below it.
Once that is clear, RSI stops being only a bounded oscillator and becomes a normalized map of price position.
→ Do I need Logit RSI to use AdaptiveRSI?
No.
Most traders can start with RSI Adaptive Zones, RSI candles, and RSI Chart Overlay.
Logit RSI is more useful if you want to study the mathematical side of the framework, compare RSI lengths in standardized space, or analyze extreme readings that are compressed on the classic 0–100 scale.
→ Why use Rescaled RSI?
Because RSI length also represents a hidden time horizon.
For example, daily RSI(70) and weekly RSI(14) observe a similar market window, but their raw values live on different scales.
Rescaled RSI translates one horizon into another reference scale, so a trader can compare broader and shorter RSI structures more coherently.
→ What is the simplest way to use the framework?
Start with RSI(14), turn on Adaptive Zones, and read RSI around the 50-point equilibrium.
Then add RSI candles.
Only after that, add Chart Overlay, Rescaled RSI, or Logit RSI if they answer a specific question on your chart.
---
13. Final takeaway
RSI is usually taught as a fixed 70/30 oscillator.
But RSI can be read more deeply.
It can show price position around equilibrium. It can reveal structure inside its own movement. It can project levels back onto price. It can adapt its thresholds to length. It can translate one horizon into another. It can expose extreme behavior that the bounded 0–100 scale compresses.
That entire framework starts with one simple observation:
From there, the practical takeaway is clear:
If this tutorial helped you see RSI differently, boost it so more traders can find the framework and the linked scripts on TradingView.
© AdaptiveRSI
0. What you already know
Most traders learn RSI as a line between 0 and 100, with 70 and 30 used as the classic overbought and oversold levels.
That is a useful starting point. But it also hides the main problem.
RSI(14) at 70 and RSI(2) at 70 are not the same signal, even though most RSI education treats them as if they were. The same RSI number can mean different things depending on length, scale, context, and time horizon.
This tutorial explains RSI through one core idea:
RSI is a normalized price position, and its interpretation should adapt to length, context, and horizon.
Once you see RSI this way, the indicator becomes more than a fixed 70/30 oscillator. It becomes a framework for reading price position, RSI structure, adaptive context, projected levels, different horizons, and extreme behavior.
📌 This is a long tutorial. You can skim the main ideas in a few minutes, but the full framework is meant to be studied, not consumed in one scroll.
---
1. A practical starting point
If you are new to AdaptiveRSI, start simple.
- Load RSI adaptive zones.
- Start with RSI(14), because it is the familiar reference scale.
- Turn on RSI candles to see structure inside RSI movement.
- Add RSI Chart Overlay if you want RSI-derived levels directly on price.
- Use Rescaled RSI when you want to compare different RSI horizons.
- Use Logit RSI when you want to study standardized RSI values and extreme readings.
You do not need to use everything at once.
The easiest entry point is still RSI(14). The difference is that AdaptiveRSI gives that familiar scale a stronger structure.
---
2. RSI as price position
Most traders focus on 70 and 30.
The first RSI level to understand is actually 50.
RSI(14) at 50 = price at its 14-period moving average.
When RSI equals 50, price is at its moving-average reference for the same length. When RSI moves above 50, price is positioned above that equilibrium. When RSI moves below 50, price is positioned below it.
That changes the way RSI can be read.
RSI is not only a momentum oscillator. It can also be interpreted as a normalized measure of price position around a moving-average equilibrium.
This is not only a visual shortcut. RSI can be derived from price position around its moving-average reference. The distance between price and that reference is normalized by recent movement and translated back into the familiar 0–100 RSI scale.
The RSI values remain the same as in the traditional formulation, but the interpretation becomes more concrete: RSI measures price position, not just momentum.
The full formula and implementation are available here: RSI: alternative derivation.
Once RSI is viewed as position, the classic 70/30 problem becomes easier to understand.
If 50 means equilibrium, then 70 means distance above equilibrium. But that distance cannot have the same meaning for every RSI length.
---
3. Why fixed 70/30 levels fail across RSI lengths
The classic 70/30 levels are simple, familiar, and useful as a first reference.
But they are not length-aware.
RSI(2), RSI(14), RSI(89), and RSI(200) do not behave the same way. Short RSI lengths move violently and touch extreme levels often. Long RSI lengths are much more compressed around 50 and may rarely reach 70 or 30 at all.
The number is the same. The event is not.
Below, you can see how RSI distributions change with lookback length.
This is the core weakness of a fixed RSI map.
RSI(2) at 70 may be routine. RSI(89) at 70 may be exceptional. Treating both as the same type of “overbought” signal removes important context.
A better approach is to compare RSI values in a standardized space first, then translate them back into practical RSI levels.
That is where the AdaptiveRSI framework begins.
Below, RSI values are normalized using Logit RSI logic. Instead of comparing raw numbers from the bounded 0–100 scale, RSI is transformed into standardized units of displacement.
A reading of +1σ is not a guaranteed trading signal. But it gives a common language for RSI displacement across different lengths.
Fixed 70/30 levels cannot do that.
---
4. RSI Adaptive Zones
Traders have been adjusting RSI interpretation for decades.
Andrew Cardwell noticed that RSI(14) often behaves differently in different market regimes, with uptrends often holding around 40–80 and downtrends around 20–60.
Connie Brown also moved RSI away from a simple mechanical 70/30 reading. She emphasized context, ranges, structure, and the way RSI behavior changes with the market environment.
Larry Connors approached the same problem from the opposite side. For very short-period RSI, he used much more extreme levels, such as 10/90, because RSI(2) behaves differently from the classic RSI(14).
John Hayden pointed toward another part of the same issue: RSI is nonlinear, especially near the edges of the 0–100 scale.
Traditional 60/40 & 80/20 thresholds on RSI(14):
These were not random disagreements about RSI.
They were signs that RSI interpretation was already adapting in practice.
Cardwell adjusted ranges. Brown emphasized context. Connors changed the levels for short-term RSI. Hayden pointed toward nonlinear behavior near extremes.
Different traders were solving different parts of the same structural problem:
RSI readings do not mean the same thing across lengths, regimes, and parts of the scale.
Adaptive Zones try to connect that intuition into one consistent framework.
Instead of forcing every RSI length into the same 70/30 map, the zones are first defined as standardized distances in transformed RSI space. Then they are translated back into RSI values for the selected length.
That distinction matters.
The starting point is no longer an arbitrary round number on the 0–100 scale. The starting point is a consistent set of sigma landmarks.
RSI(14) = 70 maps to roughly +1.53σ in the AdaptiveRSI transform.
That does not make 70 useless. It simply shows what 70 really is: one familiar point inside a broader standardized map.
The +1.53σ is not a special boundary in the Adaptive Zones framework. It is where the old round-number threshold lands after the logit transform and length-dependent scaling based on the 2/√(n−1) factor.
The full derivation is documented in the free RSI Manifesto.
This is the key point.
On the classic RSI scale, 70 looks important because it is a clean and familiar number. In standardized space, it becomes one point between other defined landmarks.
Adaptive Zones define the map in sigma space first, then translate that map back into RSI values for each length.
Adaptive Zone Summary
- Consolidation: −0.66σ to +0.66σ
- Support / Resistance: ±0.66σ to ±1σ
- Uptrend/Downtrend: ±1σ to ±√3σ
- Overbought / Oversold: ±√3σ to ±2.14σ
- Tails: outside ±2.14σ
A boundary such as +1σ or +√3σ is adjusted for the selected RSI length and converted back from transformed space into the familiar 0–100 RSI scale.
That is why the zone values change with length, while the underlying map stays consistent.
Here is an example with RSI(14). The sigma landmarks are translated back into the familiar 0–100 RSI scale, so the framework can still be read on a normal RSI chart.
This is where the idea of “quantifying tradition” becomes practical. Levels such as 40/60, 30/70, or 20/80 no longer have to be treated only as hand-adjusted rules of thumb. They can be compared against a standardized map and understood as different degrees of RSI displacement.
RSI adaptive zones on RSI(14):
The full zones as a background for the RSI indicator look like this:
The same sigma boundary can correspond to different RSI values depending on the RSI length.
Look at the pictures below. Note the zone values displayed on the right scale: for short lookback RSIs, they are placed far from the 50-point line; for long lookbacks, they stay close to the middle because this is how RSI behaves.
RSI(2)
RSI(14)
RSI(200)
The examples above show how the same standardized boundaries translate into different RSI values depending on the selected length.
For quick reference, the table below shows Adaptive Zone levels for RSI lengths arranged in a Fibonacci-like progression. This makes it easier to see how the same standardized zones compress toward the 50-point line as the RSI lookback gets longer.
📌 RSI Zones Cheat Sheet
This reflects the natural behavior of RSI. Short RSI lengths move widely across the 0–100 scale, while longer RSI lengths stay much closer to the middle. Adaptive Zones make that compression visible instead of forcing every length into the same fixed 70/30 map.
The goal is not to create automatic buy or sell signals.
The goal is to describe the RSI environment more consistently.
Near the middle of the scale, RSI often describes balance, rotation, and consolidation around equilibrium. In support and resistance zones, RSI may show reactions, pullbacks, failed pushes, or repeated tests. In stronger trend zones, RSI can remain elevated or depressed for longer than a simple overbought or oversold interpretation would suggest.
Tail zones are different again. They describe abnormal extensions, exhaustion, panic, blow-off movement, or sharp reaction risk.
⚠️ A tail zone does not mean price must reverse immediately. It means RSI has moved into a different environment, where risk and reaction potential should be interpreted differently.
A practical way to read the zones is this:
Middle / equilibrium area: consolidation, rotation, noise, and mean reversion around the average.
Adaptive support / resistance zones: reactions, pullbacks, failed pushes, repeated tests, or breakouts that may signal a change in pressure.
Strong upper / lower trend zones: active directional pressure, trend continuation, and shallow pullbacks.
Tail / extreme zones: abnormal stretch, exhaustion, panic, blow-off movement, and sharp reaction risk. This is not an automatic reversal signal.
This is the main value of Adaptive Zones.
They keep the underlying statistical reference consistent, but translate it into RSI levels that make sense for the selected length.
The question becomes not only:
Is RSI high or low?
but:
What type of RSI environment is price trading in?
---
5. One framework, five tools
AdaptiveRSI is built around one interpretation:
RSI is a normalized price position, and its interpretation should adapt to length, context, and horizon.
Each tool answers a different practical question, but all of them come from the same interpretation of RSI.
The goal is not to create a collection of unrelated indicators. The goal is to look at the same RSI framework from different angles: position, context, structure, price translation, time horizon, and standardization.
- RSI as Position shows the connection between RSI and price position around equilibrium.
- RSI Adaptive Zones make RSI interpretation length-aware.
- RSI Candles show structure inside RSI movement.
- RSI Chart Overlay projects RSI-derived levels back onto price.
- Rescaled RSI translates different horizons into a familiar reference scale.
- Logit RSI provides the mathematical bridge for standardization and extreme behavior.
You do not need every tool on every chart.
The point is that they all describe the same RSI framework instead of treating each indicator as a separate trick.
---
6. From RSI line to RSI structure
Most traders display RSI as a line.
That is clean, but it shows mainly one value per bar: the closing RSI value.
Price can be displayed with open, high, low, and close. RSI can be displayed the same way.
RSI candles show where RSI opened, how far it stretched, how low it moved, and where it finally closed. This matters because many important RSI events happen inside the bar, not only at the close.
A wick into a zone, a failed push, or a strong close inside a zone can all carry different information.
This is where RSI starts to behave less like a simple oscillator and more like a structure.
A line shows the path of closing values. Candles show pressure, rejection, continuation, and exhaustion inside RSI movement.
RSI candles can be plotted using the RSI adaptive zones script.
---
7. RSI candles and zones together
RSI candles become more useful when they are read together with Adaptive Zones.
A line can show where RSI closed. A candle can show how RSI behaved while testing a zone.
A wick into adaptive resistance followed by a close below it is not the same as a strong close inside that zone. A quick rejection from a tail zone is not the same as several accepted closes near an extreme.
In consolidation, RSI candles may show repeated rejection from adaptive support and resistance areas. In a trend, they may show shallow pullbacks and continued closes inside strong zones. In tail areas, they may show whether an extreme was rejected quickly or accepted for several bars.
This is why RSI candles are not just a visual variation.
They reveal structure inside RSI movement, and that structure becomes more meaningful when it is placed inside length-aware zones.
---
8. The translation problem between RSI and price
The standard RSI layout creates a practical problem.
The signal usually lives in the lower panel, but the decision happens on the price chart.
A trader may see RSI approaching 70, 50, 30, or an adaptive zone, but still has to translate that information back into price levels.
If RSI represents price position, then RSI levels can also be projected onto price.
That is the idea behind RSI Chart Overlay. Instead of keeping RSI levels only in the lower panel, the same levels can be shown directly on the price chart, where the trader actually makes decisions.
60/40 point thresholds projected onto price:
70/30 point thresholds projected onto price:
This changes the workflow.
The trader no longer has to constantly look down at RSI and then back up at price. The oscillator remains useful, but the relevant RSI-derived levels become visible in the same space as price action.
---
9. RSI length as a hidden time horizon
RSI length is usually treated as just an input setting.
But it also represents a hidden time horizon.
Short lengths describe short-term movement. Longer lengths describe broader market behavior. This becomes clearer when we compare RSI across timeframes, because the same market horizon can be expressed in more than one way.
A weekly RSI(14) covers roughly 70 trading days. A daily RSI(70) covers a similar horizon, because 14 weeks times 5 trading days gives about 70 daily bars.
In that sense, weekly RSI(14) and daily RSI(70) are looking at a similar market window.
The important difference is update frequency.
Weekly RSI(14) gives a new confirmed reading only after the weekly bar closes, usually on Friday. Daily RSI(70) follows a similar horizon, but it updates every day.
That means the trader can observe a broad, weekly-like RSI horizon with much higher update frequency.
But there is still a problem.
Daily RSI(70) does not behave on the same scale as the familiar RSI(14). It is usually much more compressed around 50, so its raw values cannot be interpreted with the same mental map.
If we want to compare horizons properly, we need to translate the reading first.
That is the purpose of Rescaled RSI.
First, the source RSI is transformed into standardized sigma units. Then those sigma readings are translated back into the selected RSI reference scale, usually the familiar RSI(14) scale and its Adaptive Zones.
This allows a longer-horizon RSI structure to be read through a scale that traders already understand.
For example: daily RSI(70) at 60 points maps to roughly 71.8 on the RSI(14) scale after rescaling. The raw value of 60 looks unremarkable on RSI(70), because long-period RSI stays compressed around 50. After rescaling, the same reading sits clearly above the breakout zone on the RSI(14) scale.
The goal is not to pretend that all RSI lengths are identical.
The goal is to make their interpretation comparable, so longer- and shorter-horizon RSI structure can be read inside one coherent framework.
---
10. Logit RSI as the mathematical bridge
Logit RSI is not only a tool for extreme readings.
Inside this framework, it is the mathematical bridge that makes standardization possible.
By transforming RSI out of the bounded 0–100 scale, different RSI lengths can be compared in standardized units before being translated back into adaptive RSI levels.
This also solves a practical problem near the extremes.
The classic RSI scale becomes compressed close to 0 and 100. RSI 97 and RSI 99 are only two points apart, even when the market behavior behind those readings can be very different.
Logit RSI gives that extreme behavior more room to be analyzed, especially for statistical research, short RSI lengths, and situations where the classic scale starts hiding the difference between extreme and more extreme.
RSI(2) gets compressed around 0 and 100 points:
Logit RSI(2) shows true overextensions:
For practical chart reading, RSI Adaptive Zones, RSI candles, and RSI Chart Overlay are usually easier entry points.
But Logit RSI is what allows the framework to connect bounded RSI values, standardized distances, adaptive zone levels, horizon rescaling, and extreme behavior inside one structure.
---
11. Putting it together
For almost five decades, traders have been adapting RSI interpretation in practice.
Cardwell adjusted the ranges. Brown emphasized context. Connors used much more extreme levels for short-period RSI. Hayden pointed toward nonlinear behavior near the edges of the scale.
Those approaches came from different trading styles, but they were circling the same issue:
RSI readings do not mean the same thing in every length, regime, horizon, or part of the scale.
AdaptiveRSI connects those observations into one framework built around a single interpretation: RSI as a normalized price position around a moving-average equilibrium.
The point is not to make RSI more complicated.
The point is to make RSI interpretation more consistent.
RSI(14) can remain the familiar reference. Classic 70/30 levels can remain useful as a starting point. But RSI interpretation should not be trapped inside one fixed length and two fixed numbers.
The same RSI value can mean different things depending on length, context, and horizon.
AdaptiveRSI is built to make that interpretation more visual, more consistent, and more structurally useful.
The full long-form explanation of the AdaptiveRSI framework, including the derivation, scaling logic, adaptive zones, and broader interpretation model, is available in the free 38-page RSI Manifesto.
---
12. Common questions
→ Does AdaptiveRSI replace classic RSI?
Not really. It changes the interpretation, not the indicator itself.
RSI(14) remains the most useful common reference because traders already understand it. AdaptiveRSI keeps that familiar scale, but adds structure around it: equilibrium, zones, candles, projected levels, horizon translation, and standardized extremes.
→ Is 70/30 wrong?
70/30 is not wrong. It is incomplete.
The problem begins when the same 70/30 map is applied to every RSI length as if RSI(2), RSI(14), and RSI(200) behaved the same way.
They do not.
A fixed threshold can be useful as a reference. It should not be treated as a universal interpretation system.
→ Are Adaptive Zones buy and sell signals?
No.
Adaptive Zones describe the RSI environment. They can show balance, support and resistance behavior, trend pressure, overbought or oversold pressure, and extreme tail conditions.
That information may support a trading decision, but it does not replace price action, trend context, risk management, or a complete strategy.
→ Why use sigma instead of just changing RSI levels by hand?
Manual levels can work, but they do not create one consistent map.
Sigma-based zones allow RSI interpretation to be defined in standardized space first and then translated back into practical RSI values for each length.
That is the difference between adjusting RSI by feel and using one framework across many RSI lengths.
→ Why is the 50 line so important?
Because it connects RSI directly to price equilibrium.
RSI(14) at 50 means price is at its 14-period moving average. Above 50, price is positioned above that balance. Below 50, price is positioned below it.
Once that is clear, RSI stops being only a bounded oscillator and becomes a normalized map of price position.
→ Do I need Logit RSI to use AdaptiveRSI?
No.
Most traders can start with RSI Adaptive Zones, RSI candles, and RSI Chart Overlay.
Logit RSI is more useful if you want to study the mathematical side of the framework, compare RSI lengths in standardized space, or analyze extreme readings that are compressed on the classic 0–100 scale.
→ Why use Rescaled RSI?
Because RSI length also represents a hidden time horizon.
For example, daily RSI(70) and weekly RSI(14) observe a similar market window, but their raw values live on different scales.
Rescaled RSI translates one horizon into another reference scale, so a trader can compare broader and shorter RSI structures more coherently.
→ What is the simplest way to use the framework?
Start with RSI(14), turn on Adaptive Zones, and read RSI around the 50-point equilibrium.
Then add RSI candles.
Only after that, add Chart Overlay, Rescaled RSI, or Logit RSI if they answer a specific question on your chart.
---
13. Final takeaway
RSI is usually taught as a fixed 70/30 oscillator.
But RSI can be read more deeply.
It can show price position around equilibrium. It can reveal structure inside its own movement. It can project levels back onto price. It can adapt its thresholds to length. It can translate one horizon into another. It can expose extreme behavior that the bounded 0–100 scale compresses.
That entire framework starts with one simple observation:
RSI(14) at 50 = price at its 14-period moving average.
From there, the practical takeaway is clear:
RSI is a normalized price position, and its interpretation should adapt to length, context, and horizon.
If this tutorial helped you see RSI differently, boost it so more traders can find the framework and the linked scripts on TradingView.
© AdaptiveRSI

New: "RSI Manifesto v2.0" — free 38-page download
adaptiversi.gumroad.com/l/evrgfw
Video tutorials:
youtube.com/@adaptiveRSI
adaptiversi.gumroad.com/l/evrgfw
Video tutorials:
youtube.com/@adaptiveRSI
Disclaimer
The information and publications are not meant to be, and do not constitute, financial, investment, trading, or other types of advice or recommendations supplied or endorsed by TradingView. Read more in the Terms of Use.