Analysis breakdown based on your 15M, 4H, 30W, 6M, and 4H Pyth chart stack:
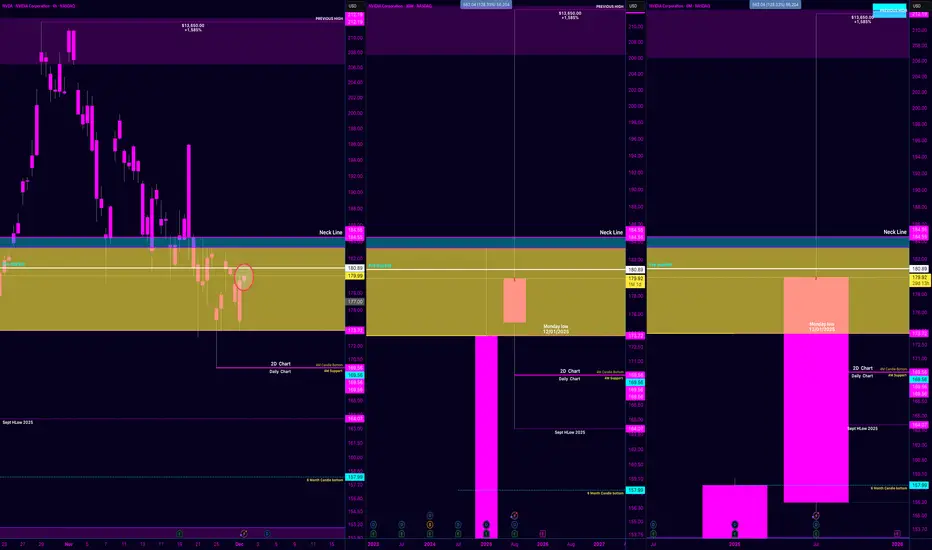
15M + 4H (Top Left & Bottom Left)
Price is coiling in a tight consolidation range between ~$177.08 and $179.99 ( yellow zone).
This oval region circled on the 15M is a classic compression pattern—looks like it's building energy for a breakout.
It's sitting just under the Neckline at $184.55, which aligns with historical resistance.
Implication: If this flag or range resolves bullish, it could trigger a rapid move to test that neckline (short-term target zone).
Weekly (30W) & Biannual (6M) – Top Middle/Right
These candles are inside the key yellow structure block as well.
The current price is reacting off the bottom of my yellow box, now pressing into the midpoint of the structure.
And why this stands out is the biannual candle (6M) shows a potential reversal candle forming off support—rare signal at this TF if confirmed.
Price targets
1st $184.55 (Neckline) High (structure alignment)
2nd $195–200 (gap fill above neckline) Medium
3rd $212.19 (Magnet Zone / Prev High)
I need to see some momentum happing THIS MONTH and for the looks of it price is looking like its gearing up and ready .
Disclaimer
The information and publications are not meant to be, and do not constitute, financial, investment, trading, or other types of advice or recommendations supplied or endorsed by TradingView. Read more in the Terms of Use.
Disclaimer
The information and publications are not meant to be, and do not constitute, financial, investment, trading, or other types of advice or recommendations supplied or endorsed by TradingView. Read more in the Terms of Use.