
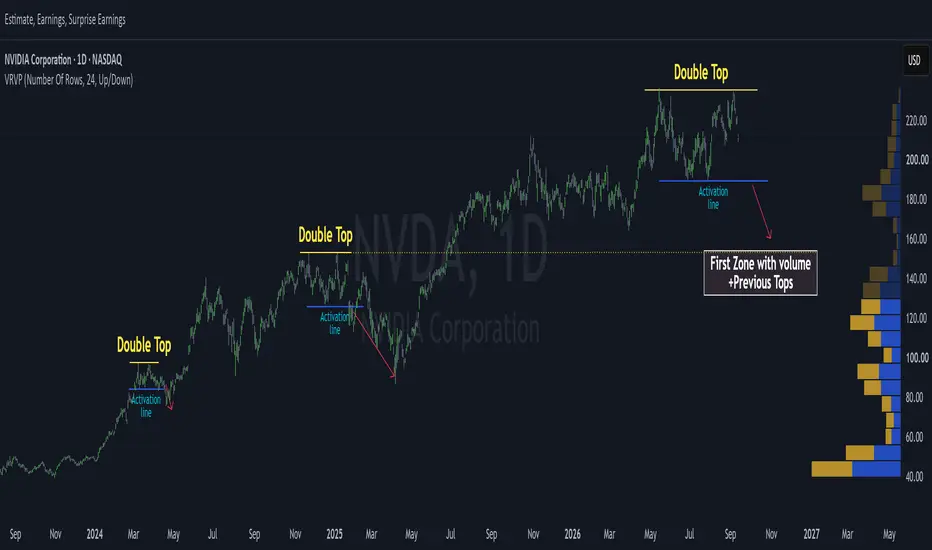
NVDA Has Printed Its Third Double Top
NVDA has made three double tops (yellow) in three years. The first two ended the same way. Price lost the blue activation line, and a drop followed.
Now we have the third one. And this is BIGGER.
A double top is simple. Buyers push price up to a level, they fail, they rest, and they try again at the same level. They fail again. Two attempts, same wall.
That tells you the buyers are getting tired.
One pattern on one stock does not make a market top. Agreed. On its own, this chart means little. So let me show you more.
The divergence
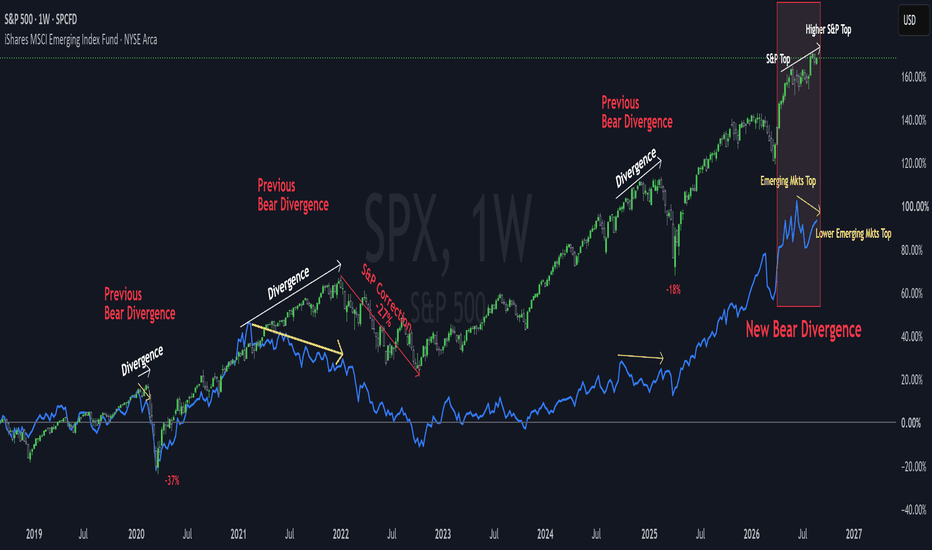
In my last ideas I showed the divergence in the SPX and in Emerging Markets. Price made new highs, but the internals did not follow. Fewer stocks are carrying the index. That is the same tiredness, seen from above.
Where the money goes
When risk gets tired, money does not disappear. It moves.
Today bonds pay a real return, something we had forgotten for years. A calm 4% or 5% looks very good next to a stock that just failed twice at the same price. And bonds have a second gift. If a crisis comes and central banks cut rates, bond prices go up. Money leaves risk and goes to quality.
That is the normal cycle, and it can last a long time.
For a long time, we all forgot about bonds and fixed income, but at zero rates it was useless. Now, with real rates positive and the markets overheated, bonds are becoming the place to be for the smart guys.
The chart
The blue line is the low between the two tops. It is not a target. It is the level where the pattern becomes real. Above it, this is just two failed attempts. Below it, the last two times, the drop was hard. Below that, the dotted line near $155 is the first zone with real volume and the previous tops.
And you?
Serious correction, or just one more pause before the rally continues?
NVDA has made three double tops (yellow) in three years. The first two ended the same way. Price lost the blue activation line, and a drop followed.
Now we have the third one. And this is BIGGER.
A double top is simple. Buyers push price up to a level, they fail, they rest, and they try again at the same level. They fail again. Two attempts, same wall.
That tells you the buyers are getting tired.
One pattern on one stock does not make a market top. Agreed. On its own, this chart means little. So let me show you more.
The divergence
In my last ideas I showed the divergence in the
SPX and in Emerging Markets. Price made new highs, but the internals did not follow. Fewer stocks are carrying the index. That is the same tiredness, seen from above.Where the money goes
When risk gets tired, money does not disappear. It moves.
Today bonds pay a real return, something we had forgotten for years. A calm 4% or 5% looks very good next to a stock that just failed twice at the same price. And bonds have a second gift. If a crisis comes and central banks cut rates, bond prices go up. Money leaves risk and goes to quality.
That is the normal cycle, and it can last a long time.
For a long time, we all forgot about bonds and fixed income, but at zero rates it was useless. Now, with real rates positive and the markets overheated, bonds are becoming the place to be for the smart guys.
The chart
The blue line is the low between the two tops. It is not a target. It is the level where the pattern becomes real. Above it, this is just two failed attempts. Below it, the last two times, the drop was hard. Below that, the dotted line near $155 is the first zone with real volume and the previous tops.
And you?
Serious correction, or just one more pause before the rally continues?

Most days the market gives you nothing worth playing.
A few times a month it hands you two aces ♠️♦️.
I tell you when that happens & why, after studying more than 8 million patterns across 30 years.
👉topchartpatterns.substack.com/embed
A few times a month it hands you two aces ♠️♦️.
I tell you when that happens & why, after studying more than 8 million patterns across 30 years.
👉topchartpatterns.substack.com/embed
Related publications
Disclaimer
The information and publications are not meant to be, and do not constitute, financial, investment, trading, or other types of advice or recommendations supplied or endorsed by TradingView. Read more in the Terms of Use.