📘 Trade Summary
Pair: NVDA (NASDAQ)
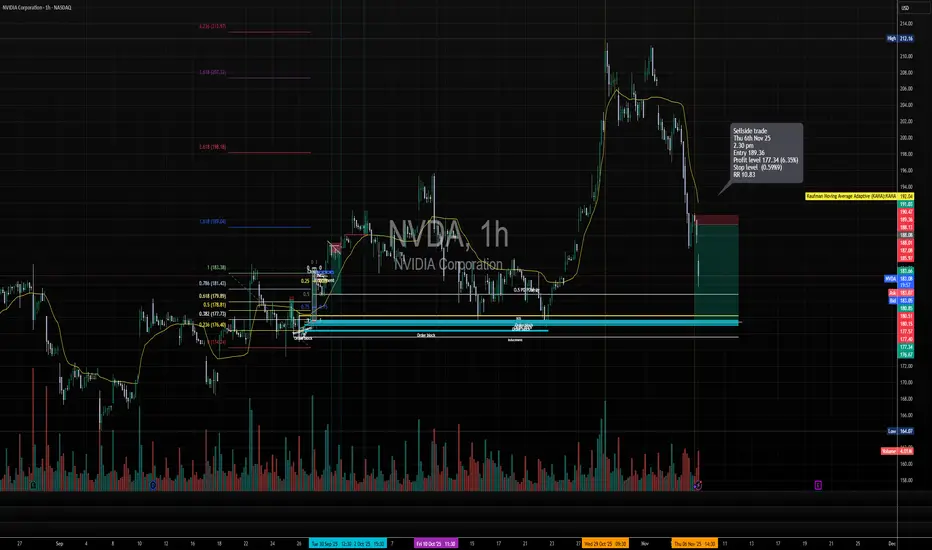
Direction: Sell-side Trade
Date: Thu 6 Nov 25
Time: 2:30 pm
Entry: 189.36
Profit Level: 177.34 (+6.35%)
Stop Level: 189.99 (–0.59%)
Risk-Reward (RR): 10.83

🧩 Technical Context
Price Structure: Market rejected near the previous swing high (~$197–$200 region) after failing to sustain above the 1.618 extension level.
Fibonacci Context: Retracement zones from 0.382 – 0.786 aligned with prior accumulation zones, showing resistance at 0.618 (≈ 179.89) and 0.786 (≈ 181.43).
Order Block Alignment: Two visible order blocks (highlighted in blue) show prior demand zones — price is expected to retrace into these for potential take-profit liquidity.
Volume Spike: Noticeable volume at the rejection candle near $190–$191 indicates institutional sell orders stepping in.
EMA Context: Price fell below the Kaufman Adaptive Moving Average (KAMA), confirming a short-term shift to bearish momentum.
🧠 Trade Narrative
This short setup capitalises on:
A failed breakout at the prior liquidity high (~$197),
Break of structure (BOS) confirming downside shift, and
Entry at the retest of a supply zone near $189.
Targeting liquidity sweep of prior accumulation zone around $177, where confluence with the lower order block exists.
Pair: NVDA (NASDAQ)
Direction: Sell-side Trade
Date: Thu 6 Nov 25
Time: 2:30 pm
Entry: 189.36
Profit Level: 177.34 (+6.35%)
Stop Level: 189.99 (–0.59%)
Risk-Reward (RR): 10.83
🧩 Technical Context
Price Structure: Market rejected near the previous swing high (~$197–$200 region) after failing to sustain above the 1.618 extension level.
Fibonacci Context: Retracement zones from 0.382 – 0.786 aligned with prior accumulation zones, showing resistance at 0.618 (≈ 179.89) and 0.786 (≈ 181.43).
Order Block Alignment: Two visible order blocks (highlighted in blue) show prior demand zones — price is expected to retrace into these for potential take-profit liquidity.
Volume Spike: Noticeable volume at the rejection candle near $190–$191 indicates institutional sell orders stepping in.
EMA Context: Price fell below the Kaufman Adaptive Moving Average (KAMA), confirming a short-term shift to bearish momentum.
🧠 Trade Narrative
This short setup capitalises on:
A failed breakout at the prior liquidity high (~$197),
Break of structure (BOS) confirming downside shift, and
Entry at the retest of a supply zone near $189.
Targeting liquidity sweep of prior accumulation zone around $177, where confluence with the lower order block exists.
Trade active
Stop level moved (3.34%)
Trade closed: target reached
Disclaimer
The information and publications are not meant to be, and do not constitute, financial, investment, trading, or other types of advice or recommendations supplied or endorsed by TradingView. Read more in the Terms of Use.
Disclaimer
The information and publications are not meant to be, and do not constitute, financial, investment, trading, or other types of advice or recommendations supplied or endorsed by TradingView. Read more in the Terms of Use.