
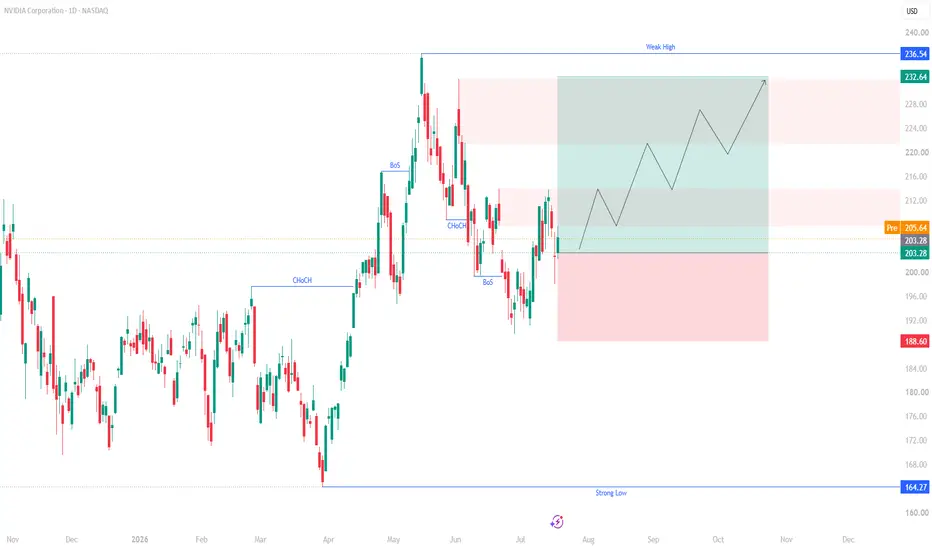
NVDA continues to maintain a bullish market structure despite the recent pullback. The chart shows that the stock has successfully defended the $188–$195 demand zone and is attempting to establish a higher low after a healthy correction from its recent peak.
The previous Break of Structure remains intact, indicating that the primary uptrend has not been invalidated. Recent price action suggests a potential accumulation phase, with buyers stepping in around key support levels. Holding above $203 is crucial to preserve the bullish bias.
A sustained move above $212–215 could trigger fresh buying momentum, opening the path toward $220, followed by $228–232. If bullish momentum continues, NVDA may eventually retest its previous swing high near $236.50, where the next major liquidity zone resides.
Key Levels
Support: $203 → $195 → $188
Resistance: $212 → $220 → $232 → $236.50
Trading View
Bias: Bullish
Entry Zone: $203–205
Stop Loss: Below $188.60
Targets:
Target 1: $212
Target 2: $220
Target 3: $232
Extended Target: $236.50+
Conclusion: As long as NVDA holds above the $203 support and especially $188.60, the overall technical structure favors continuation to the upside. A breakout above $212–215 would strengthen the bullish case and could pave the way for a retest of the all-time highs near $236.50.
Trade active
NVDA trade is running +10.72% profit 📈The stock continues to show strong bullish momentum, supported by sustained AI demand and positive market sentiment. Recent developments around large-scale AI infrastructure investments are also supporting the long-term growth story for NVIDIA.
🔹 Current Trend: Bullish
🔹 Strategy: Trail stop loss to protect profits
🔹 Outlook: As long as the stock maintains higher highs and higher lows, the uptrend remains intact.
🎯 Profit Running: +10.72%
💰 Book partial profits if desired and let the remaining position ride with a trailing stop.
Well-managed trades lead to consistent results. 📊
Trade closed: target reached

Disclaimer
The information and publications are not meant to be, and do not constitute, financial, investment, trading, or other types of advice or recommendations supplied or endorsed by TradingView. Read more in the Terms of Use.
Disclaimer
The information and publications are not meant to be, and do not constitute, financial, investment, trading, or other types of advice or recommendations supplied or endorsed by TradingView. Read more in the Terms of Use.