NVDA Is Creating The More Bearish Pattern
The NVDA chart is currently screaming something that most retail investors, blinded by the AI narrative, are choosing to ignore. While the fundamental sentiment remains bullish, the price structure on the daily timeframe is carving out one of the most reliable reversal patterns in technical analysis.
But be careful!! Structure is not a signal until confirmed.
In fact, what looks like a bearish threat might actually be a good buying opportunity, depending on what does the price next.
Let's break it down.
⚠️ The Threat: The Head and Shoulders Top
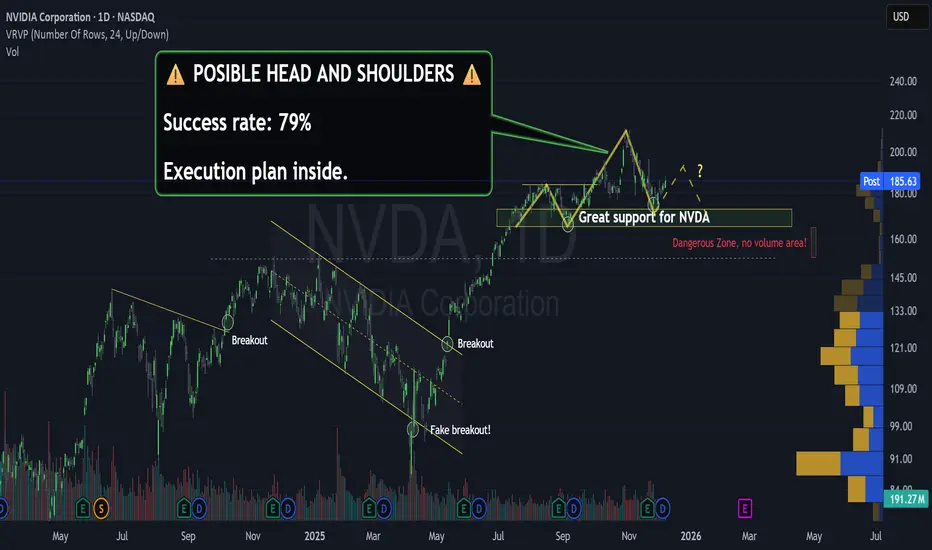
As annotated on the chart, NVDA has completed the "Left Shoulder" and the "Head," and we are currently navigating the formation of the "Right Shoulder."
The Stat
Historically, this structure, when validated by a break of the neckline, carries a statistical success rate of roughly 79% in reaching its projected target.
The Psychology
Head and Shoulders represents buyer exhaustion. The price attempted to make a new high (Head), failed, and is now struggling to regain that momentum.
🛡️ The Defense
The Volume Wall (Critical Support).
This is where the analysis separates the amateurs from the pros. You cannot simply short a stock because you see a pattern drawing. Context is everything.
If you look at the Volume Profile (VRVP) on the right side of the chart, you will see a massive concentration of transactions right where we are sitting (the yellow box marked as "Great support for NVDA").
This area is the last line of defense for the bulls.
Structural Support, acts as the "Neckline" of the H&S pattern. As long as price holds above this level, the bearish pattern is NOT active.
Tactical Long, Because this support is so heavy with institutional volume, the Risk/Reward ratio for a long position here is excellent. The invalidation point is clear, and the potential for a bounce to complete the right shoulder is high. This opportunity was posted by me in Tradingview previously, but maybe we can see it once again.

💀 The "Dangerous Zone"
Pay attention to the area immediately below our support box. The chart marks it clearly: "Dangerous Zone, no volume area!"
This is a Liquidity Void (Low Volume Node). If NVDA loses this support, there is no historical volume to act as friction, translated, NO ONE IS WILLING TO BUY THERE!!!.
If the price breaks into this zone, the move down will likely be fast and violent, confirming the H&S and accelerating the correction.
⚖️ The Verdict
We are at a binary inflection point. Do not guess, react to the key levels:
For now, the best short term position is to hold or stay out if you are not in NVDA.
⭐ Here is where the Pattern makes you money
The structure tells you exactly where to enter to minimize risk, providing a clear Stop Loss level and a mathematical target.
Remember: 80% of trading success isn't finding the pattern, it's executing the exit strategy properly.
👇 WANT THE EXACT STRATEGY?
I have broken down this complete analysis with the precise execution levels (Entry Price, Stop Loss, Profit Target).
🚀 Check my SIGNATURE to start trading seriously.
The
But be careful!! Structure is not a signal until confirmed.
In fact, what looks like a bearish threat might actually be a good buying opportunity, depending on what does the price next.
Let's break it down.
⚠️ The Threat: The Head and Shoulders Top
As annotated on the chart, NVDA has completed the "Left Shoulder" and the "Head," and we are currently navigating the formation of the "Right Shoulder."
The Stat
Historically, this structure, when validated by a break of the neckline, carries a statistical success rate of roughly 79% in reaching its projected target.
The Psychology
Head and Shoulders represents buyer exhaustion. The price attempted to make a new high (Head), failed, and is now struggling to regain that momentum.
🛡️ The Defense
The Volume Wall (Critical Support).
This is where the analysis separates the amateurs from the pros. You cannot simply short a stock because you see a pattern drawing. Context is everything.
If you look at the Volume Profile (VRVP) on the right side of the chart, you will see a massive concentration of transactions right where we are sitting (the yellow box marked as "Great support for NVDA").
This area is the last line of defense for the bulls.
Structural Support, acts as the "Neckline" of the H&S pattern. As long as price holds above this level, the bearish pattern is NOT active.
Tactical Long, Because this support is so heavy with institutional volume, the Risk/Reward ratio for a long position here is excellent. The invalidation point is clear, and the potential for a bounce to complete the right shoulder is high. This opportunity was posted by me in Tradingview previously, but maybe we can see it once again.
💀 The "Dangerous Zone"
Pay attention to the area immediately below our support box. The chart marks it clearly: "Dangerous Zone, no volume area!"
This is a Liquidity Void (Low Volume Node). If NVDA loses this support, there is no historical volume to act as friction, translated, NO ONE IS WILLING TO BUY THERE!!!.
If the price breaks into this zone, the move down will likely be fast and violent, confirming the H&S and accelerating the correction.
⚖️ The Verdict
We are at a binary inflection point. Do not guess, react to the key levels:
- Bull Scenario: Support holds -> We trade the bounce towards the Right Shoulder peak.
- Bear Scenario: Support fails -> We enter the "Dangerous Zone" targeting the downside projection.
For now, the best short term position is to hold or stay out if you are not in NVDA.
⭐ Here is where the Pattern makes you money
The structure tells you exactly where to enter to minimize risk, providing a clear Stop Loss level and a mathematical target.
Remember: 80% of trading success isn't finding the pattern, it's executing the exit strategy properly.
👇 WANT THE EXACT STRATEGY?
I have broken down this complete analysis with the precise execution levels (Entry Price, Stop Loss, Profit Target).
🚀 Check my SIGNATURE to start trading seriously.
⚡ Stop Trading the Noise. Trade Profitable Chart Patterns.
📊 I turn Market Chaos into Statistical Probabilities. 👇 Get my Weekly Opportunities here: topchartpatterns.substack.com/subscribe
📩 Business: info@topchartpatterns.com
📊 I turn Market Chaos into Statistical Probabilities. 👇 Get my Weekly Opportunities here: topchartpatterns.substack.com/subscribe
📩 Business: info@topchartpatterns.com
Related publications
Disclaimer
The information and publications are not meant to be, and do not constitute, financial, investment, trading, or other types of advice or recommendations supplied or endorsed by TradingView. Read more in the Terms of Use.