
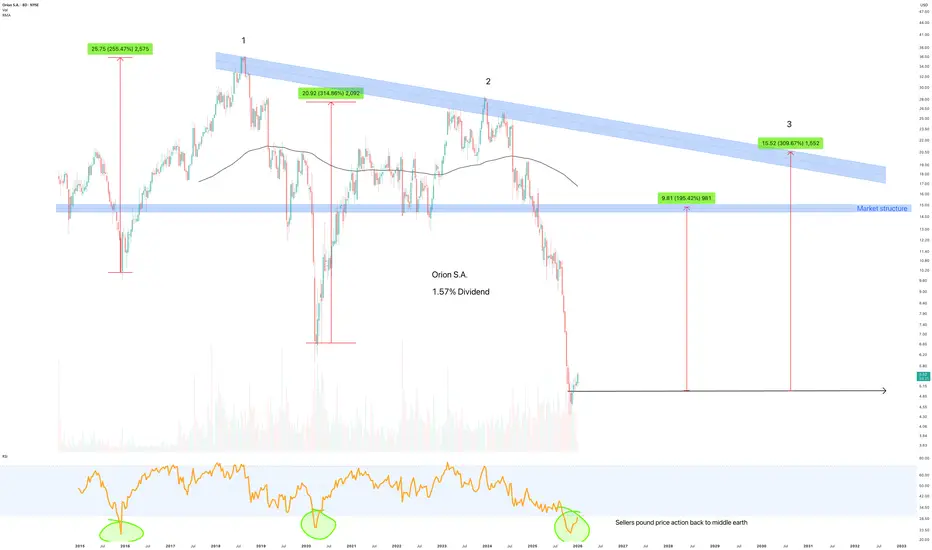
Ticker: NYSE:OEC (Orion S.A.)
Timeframe: Weekly
Core thesis
OEC has spent the last year mimicking a lift (in American you say elevator, in English we say lift) in free fall as the overspeed governor decides "there’s no way I can stop this". Proper waterfall stuff. The kind of chart that makes you question free will.
But…. the weekly, actually it’s an 8 day chart we got here, is now printing what might be the first whiff of seller exhaustion.
A violent capitulation into the circa $5 area, RSI crushed into the basement (again, look left) as price attempts to stabilise after being absolutely humbled. If this base hold, the upside isn’t a “nice little bounce”, it’s a mean reversion back toward prior market structure. The $15 zone and potentially the underside of the long term descending channel, circa $20. That’s between 200-300%. Not unlike the previous trips back up north when RSI was that those levels.
This is not a “strong uptrend” setup. This is a “they’ve stopped punching it for five minutes” setup. High risk, high torque.
Key levels
$5.15 to $5.90 is current stabilisation area after the sell off. Bulls will want to see weekly closes holding above this range. If you want to get fancy, a higher low forming above $5.15 is the whole story.
Test point 1: $10-11
The first major reaction area, psychological level.
Test point 2: $14-15
The big blue market structure shelf shown on the chart. This is a proper mean reversion target. 190% from the base area.
Test point 3: $20-21
Where downtrend goes to ruin your optimism. If price action tags this line, expect sellers to show up like it’s happy hour. 300% from base.
Test point 4: $25-26
If we get here, congratulations. Long term resistance breakout, not untypical for 3rd attempts. The chart has gone from “tragedy” to “farce”, and you should be scaling out aggressively.
Conclusions
Orion S.A. looks like it may be carving a weekly base after an ugly, extended dump. The only bullish argument is that capitulation + RSI washout have now bottomed out. Should price action stabilise, then a run to market structure increases in likelihood. But let’s be honest, this is a trade built on hope that the sellers have finally got tired. Keep risk tight, respect invalidation, and don’t marry it. It’s not that kind of relationship.
Ww
=====================================
Disclaimer
This is not financial advice, it’s technical analysis, not a guarantee, not a signal service, and definitely not a substitute for your own research. Markets are risky; beaten-down names can stay beaten-down. Manage position size, use stops appropriate to volatility and assume you can be wrong (often). I may hold a position at any time, and this idea can be invalidated without notice.
Trade active
Active on publication.Note
Nudge nudge wink wink
Disclaimer
The information and publications are not meant to be, and do not constitute, financial, investment, trading, or other types of advice or recommendations supplied or endorsed by TradingView. Read more in the Terms of Use.
Disclaimer
The information and publications are not meant to be, and do not constitute, financial, investment, trading, or other types of advice or recommendations supplied or endorsed by TradingView. Read more in the Terms of Use.