
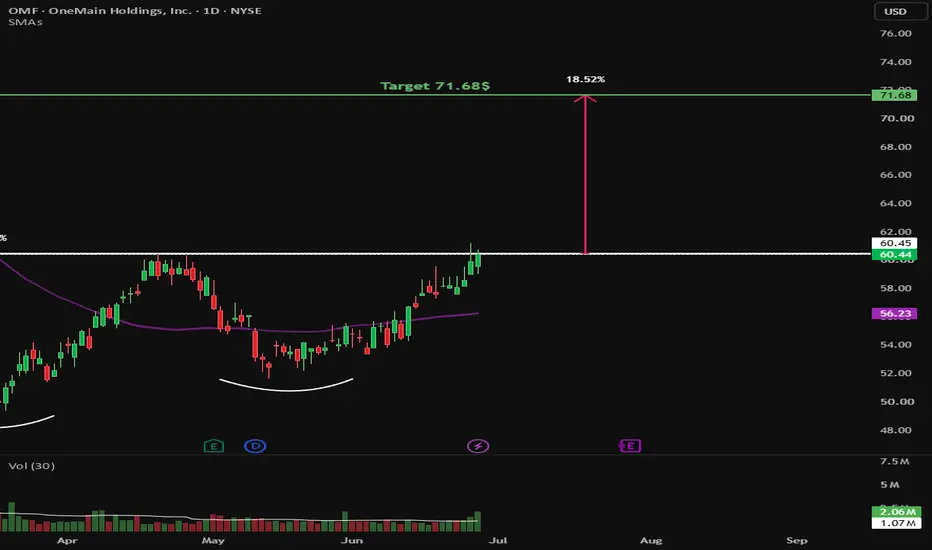
💡 Swing setup idea
🔎 Analysis summary:
The stock crossed above the 50 SMA and closed a double bottom pattern. We are seeing growing, above-average buyers' volume stepping in to support the move.
🔔 Friendly reminder: The broader market is currently trending down, so please keep market weakness in mind before entering any new trades.
👀 Levels to watch:
Entry trigger: Break above $60.45
Target: $71.68
Stop: Under the breakout level
💬 What do you think of this setup? Let me know in the comments! 👇
Good luck!
⚠️ Note: This is for educational purposes only and is not financial advice.

📈 Follow for more swing setups & market analysis!
🎯 Want my opinion on a specific stock?
Hit the link below👇
ko-fi.com/c/82990ede9f
🎯 Want my opinion on a specific stock?
Hit the link below👇
ko-fi.com/c/82990ede9f
Disclaimer
The information and publications are not meant to be, and do not constitute, financial, investment, trading, or other types of advice or recommendations supplied or endorsed by TradingView. Read more in the Terms of Use.