
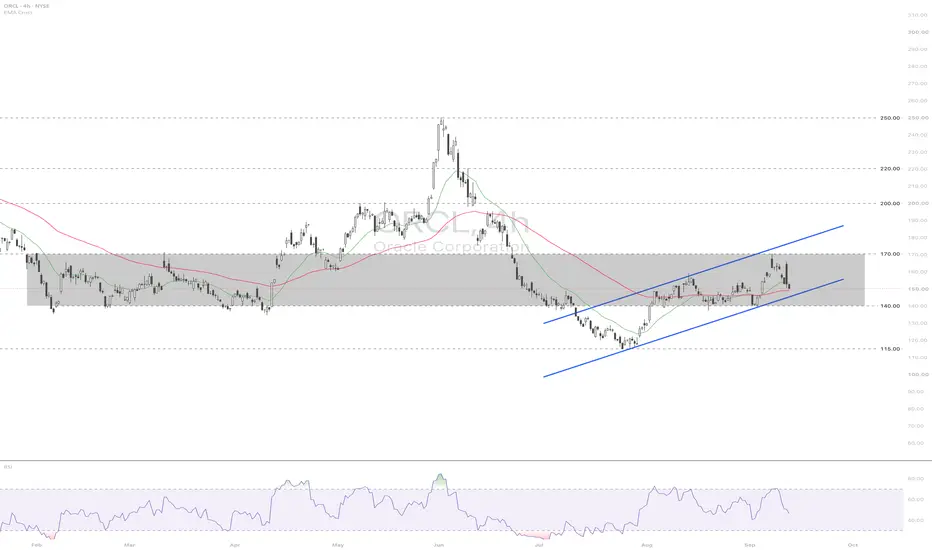
ORCL | 4H Technical Analysis — Sep 14, 2026
Oracle whipsawed sharply after its fiscal Q1 earnings release, initially spiking as much as 10.3% intraday before reversing to close down 1.74% at 150.28, leaving the stock down 4.39% over the past two years despite the headline growth numbers. The reversal reflects a genuinely split earnings picture. Revenue grew roughly 30% YoY, and the core cloud infrastructure business surged 121%, with remaining performance obligations reaching $664 billion at quarter-end after more than $30 billion in new contracts signed during the quarter alone. On the surface, this confirms Oracle's transformation into a serious cloud infrastructure competitor.
The cost of that growth is what spooked the market on the reversal. Oracle poured $28.5 billion into capital expenditures last quarter, more than triple the prior year's pace, pushing free cash flow to negative $5.4 billion. Total debt has climbed to roughly $156 billion, and gross margin compressed to 61% from 66.3% the previous quarter. The debt chart shows this is not a one-quarter anomaly. Oracle's total debt has roughly doubled since Q4 2024, a direct byproduct of the aggressive infrastructure buildout needed to service its cloud contract backlog.
ORCL spent January through April consolidating in a wide 140 to 170 range before a sharp cloud-driven rally in May and June pushed price to a high near 250. That spike proved unsustainable, and price fell hard through July to a low near 115, effectively unwinding the entire cloud euphoria rally. Since that July low, price has climbed steadily inside a well-defined ascending channel, reclaiming the 140 to 170 range and now trading around 150, back inside the same box that contained price for the first four months of the year.
The EMA cross shows the fast EMA at 153.33 just above the slow EMA at 149.13, a mildly bullish but tightly compressed setup that reflects the current indecision. RSI at 46.56 sits almost exactly at the midpoint, offering no directional edge either way. Price is currently pressing against the lower boundary of the old range near 150, the same level where the two-year chart shows Oracle essentially unchanged despite the intervening volatility.
Key levels to watch:
Resistance: 170 (top of multi-month range) / 200 (psychological level, June retracement zone)
Support: 140 (bottom of multi-month range) / 115 (July swing low)
Bear case: The margin compression from 66.3% to 61%, negative free cash flow, and debt load nearly doubling in under two years suggest Oracle is buying growth at a steep financial cost, and the earnings day reversal from plus 10% to a net loss shows the market is already uneasy about that trade-off. A break below the ascending trendline and the 140 range floor would confirm the growth story is losing credibility with investors and open a retest of the 115 July low.
Bull case: The underlying growth numbers, 121% cloud infrastructure growth and a $664 billion order backlog, are difficult to dismiss, and if Oracle can show the capex spending translates into sustained revenue conversion in coming quarters, the current pullback becomes a buying opportunity within the still-intact ascending channel. A reclaim of 170 would resume the broader uptrend from the July low.
Bias is neutral to cautiously bullish while price holds above the ascending trendline near 140, with the market currently undecided on whether Oracle's cloud growth justifies its deteriorating margins and ballooning debt. The earnings-day reversal is the key signal here. Strong headline numbers weren't enough to hold gains once investors examined the balance sheet details, and that skepticism needs to clear before the stock can push convincingly back toward 170 and beyond.

Disclaimer
The information and publications are not meant to be, and do not constitute, financial, investment, trading, or other types of advice or recommendations supplied or endorsed by TradingView. Read more in the Terms of Use.
Disclaimer
The information and publications are not meant to be, and do not constitute, financial, investment, trading, or other types of advice or recommendations supplied or endorsed by TradingView. Read more in the Terms of Use.