Occidental Petroleum's bearish setup points to near-term weaknes
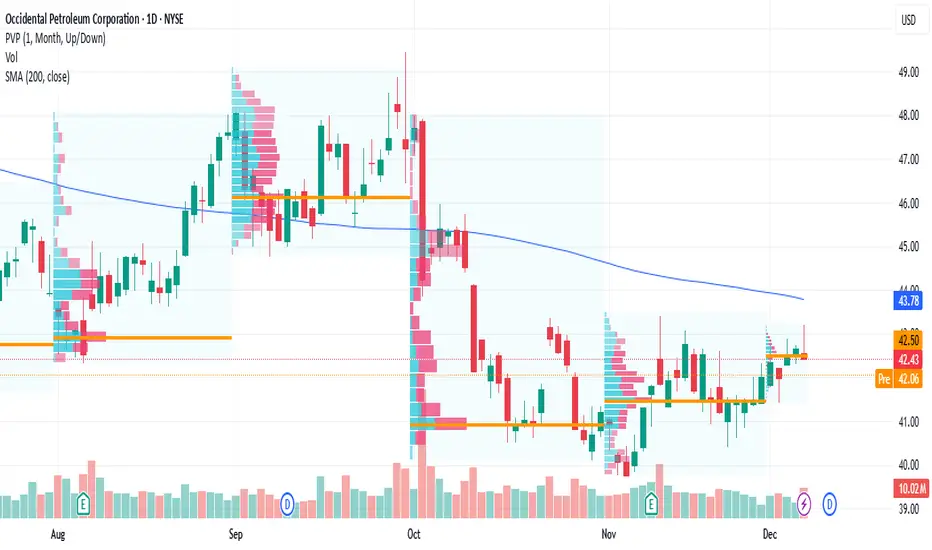
Current Price: $42.43
Direction: SHORT
Confidence Level: 62% (Based on trader consensus leaning bearish, mixed but cautious X sentiment, and recent inability to break key resistance)
Targets:
- T1 = $41.60
- T2 = $40.80
Stop Levels:
- S1 = $43.40
- S2 = $44.20
**Wisdom of Professional Traders:**
Several professional traders are indicating a bearish leaning for Occidental Petroleum this week. The collective trader consensus highlights weak cash flow at current oil prices, recent asset divestments, and resistance around the $44 level as key factors limiting upside. By pooling these perspectives, it's clear the trading community sees the balance of risk tilted to the downside in the short term.
**Key Insights:**
Here's what's driving this call: most trader analyses are focusing on how Occidental's recent earnings miss (net income down over 25% YoY) weakened sentiment, and multiple hedge funds have trimmed positions. The trading crowd is pointing out that oil remains under pressure and Occidental needs prices above $45/barrel to comfortably sustain dividends. Recent asset sales to Berkshire Hathaway are seen as long-term strategic moves but not an immediate earnings driver.
What's also interesting is that X sentiment, while containing bullish voices, has a slightly higher proportion of bearish posts calling for caution. That mix shows traders are getting defensive rather than chasing upside. With price failing to hold above $44 multiple times in recent weeks, resistance is proving stubborn.
**Recent Performance:**
Over the past week, OXY has slipped 1.59% and struggled to maintain gains despite a 2.12% monthly rise. It tested the $43.20 zone but quickly reversed, showing sellers stepping in near resistance. The stock is also down roughly 17% over the past year, pointing to a broader weak trend that hasn’t materially reversed since early fall.
**Expert Analysis:**
Multiple professional traders I track have identified $44 as critical resistance. They see the repeated failures there as a sign that short-term momentum is fading. Chart-wise, the support area around $41 has been tested but not convincingly broken yet — the main call is that if $41 gives way, $40 becomes the next natural target. Fundamentals add weight: revenue dropped nearly 8% year-on-year, and operating expenses have ticked up.
On the flip side, those bullish argue company debt reduction and renewable energy investments could pay off longer term, but they admit short-term risk is elevated.
**News Impact:**
Recent headlines about large institutional shareholders cutting positions reinforce bearish sentiment. The asset sale to Berkshire Hathaway was well-received strategically, but for traders looking at the next week, reduced positions from Fisher Asset Management and Mirabella send a cautionary signal. Morgan Stanley's price target cut to $51 adds to the cautious tone, even if the long-term fair value remains higher.
**Trading Recommendation:**
Here's my take: the setup favors a short move from current levels, aiming for $41.60 this week and $40.80 if momentum accelerates. Resistance at $43.40 and $44.20 are key stop zones to manage risk. Position sizing should be modest given mixed social sentiment but lean into the professional trader consensus on short bias. If $41 breaks, be ready for a quick run towards $40.
Disclaimer
The information and publications are not meant to be, and do not constitute, financial, investment, trading, or other types of advice or recommendations supplied or endorsed by TradingView. Read more in the Terms of Use.
Disclaimer
The information and publications are not meant to be, and do not constitute, financial, investment, trading, or other types of advice or recommendations supplied or endorsed by TradingView. Read more in the Terms of Use.