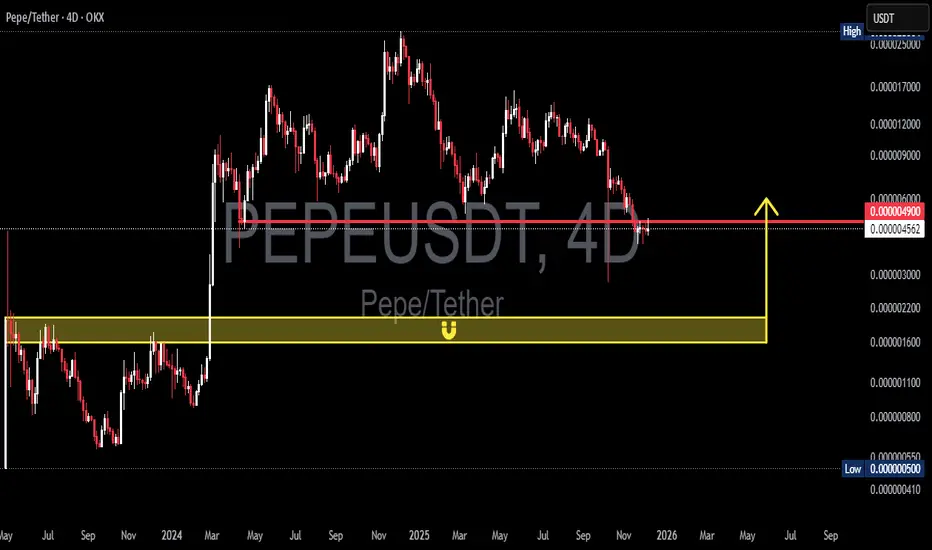
PEPE is approaching one of its most critical decision points since the major rally of 2024–2025. After forming a clean sequence of lower highs and sliding into a broader distribution phase, the market recently printed a deep liquidity sweep below local support — a signature move often associated with smart-money positioning.
Now the price is pulling back toward the 0.0000049 key resistance, a level that has historically acted as a battlefield between buyers and sellers. This level will decide whether PEPE regains momentum or continues its mid-term downtrend.
But the real story is below:
The yellow demand zone at 0.0000020 – 0.0000016 is the strongest structural support on the chart.
This area previously sparked a powerful upside reversal and will once again act as the final defensive wall if the market continues to drop.
---
✨ Bullish Scenario — The Reversal Signal Everyone Is Watching
A bullish reversal is not confirmed by a simple bounce.
It becomes valid only when PEPE can:
1. Close a 4D candle ABOVE 0.0000049
→ Indicates buyers taking structural control.
2. Retest the level successfully without breaking back below
→ Confirms the breakout is real and not a fakeout.
If these two conditions occur, the natural upside targets are:
0.0000060 (TP1) — minor supply
0.0000090 (TP2) — historical magnet
0.0000120 (TP3) — potential trend-shift zone
With proper volume, the structure can transition from bearish → neutral → bullish.
---
🔥 Bearish Scenario — Path Toward the Yellow Box
If the price gets rejected again at 0.0000049, bearish pressure remains dominant.
This opens two likely moves:
1. A controlled decline into the 0.0000020 – 0.0000016 demand zone
→ This zone is where large buyers typically step in.
2. A breakdown below 0.0000016
→ Signals a deeper structural flush
→ Indicates the market is cleaning liquidity before forming a new macro base.
In short:
0.0000020 – 0.0000016 is the battlefield that decides PEPE’s next major trend.
---
🎯 Pattern & Market Structure Insights
Well-defined downtrend with consistent lower highs
Clear liquidity sweep signaling institutional presence
Price currently trading between two extreme decision levels:
Key Resistance: 0.0000049
Major Demand: 0.0000020 – 0.0000016
This is a classic “decision point setup.”
The next move from here can define PEPE’s next multi-week or multi-month trend.
---
#PEPE #PEPEUSDT #CryptoAnalysis #MarketStructure #AltcoinAnalysis #DemandZone #LiquiditySweep #PriceAction #CryptoTA
✅ Get Free Signals! Join Our Telegram Channel Here: t.me/TheCryptoNuclear
✅ Twitter: twitter.com/crypto_nuclear
✅ Join Bybit : partner.bybit.com/b/nuclearvip
✅ Benefits : Lifetime Trading Fee Discount -50%
✅ Twitter: twitter.com/crypto_nuclear
✅ Join Bybit : partner.bybit.com/b/nuclearvip
✅ Benefits : Lifetime Trading Fee Discount -50%
Disclaimer
The information and publications are not meant to be, and do not constitute, financial, investment, trading, or other types of advice or recommendations supplied or endorsed by TradingView. Read more in the Terms of Use.