
If you haven`t bought PLTR before the rally:

Nor sold the top after my signal:

Now you need to know Michael Burry’s Bearish Take on Palantir (PLTR): A Head & Shoulders Warning!
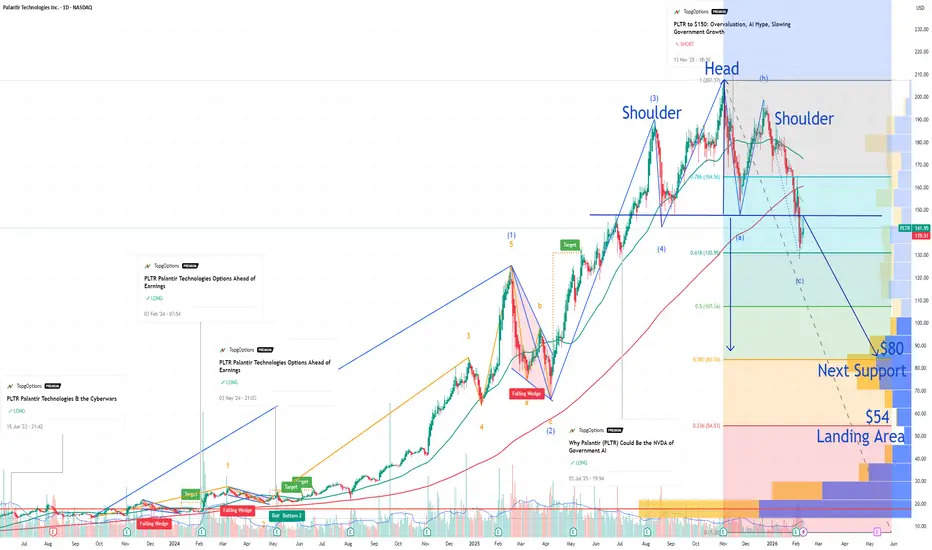
Palantir Technologies (PLTR) has been one of the most explosive AI-driven stocks of the past cycle, rallying from pandemic-era lows near $6 in 2022 to an all-time high above $207 in November 2025. However, according to a technical setup recently highlighted by legendary investor Michael Burry, this parabolic advance may now be unwinding.
Burry’s chart points to a classic Head & Shoulders top, a pattern that often marks the transition from euphoria to distribution—and, eventually, to a deeper corrective phase.
Who Is Michael Burry?
Michael Burry is the founder of Scion Asset Management and the investor made famous for predicting and profiting from the 2008 subprime mortgage collapse. His bet against the U.S. housing market was later chronicled in The Big Short, where he was portrayed by Christian Bale.
Burry is widely known for his contrarian approach, focusing on valuation extremes, market psychology, and late-cycle excess. He has frequently warned about speculative bubbles, including tech and AI-related themes, often publishing—and then deleting—brief but highly scrutinized market observations.
The Head & Shoulders Structure on PLTR
On February 10, 2026, Burry shared a chart of Palantir on X (formerly Twitter), annotated with a textbook Head & Shoulders formation:
Left Shoulder: Formed in mid-2025, topping near $150–160, followed by a sharp pullback.
Head: The cycle peak at ~$207 in November 2025, driven by peak AI enthusiasm, index inclusion, and strong earnings momentum.
Right Shoulder: A lower high in early 2026, again near $160–170, failing to reclaim the prior peak—an early sign of trend exhaustion.
Neckline: A key horizontal support zone around $145, now being actively tested.
A decisive break below the neckline typically confirms the pattern and opens the door to accelerated downside pressure.
Fibonacci Levels Confirm the Downside Risk
To assess potential downside targets, Fibonacci retracement levels were drawn from the 2022 low (~$6) to the 2025 high (~$207). These levels align closely with the Head & Shoulders projections:
0.618 retracement: ~$131
An initial bounce zone, already tested during the recent pullback.
0.50 retracement: ~$107
A psychological midpoint, but not a major structural support.
0.382 retracement: ~$84
Next major support, aligning with the classic measured move of the Head & Shoulders pattern.
0.236 retracement: ~$54
The highlighted “landing area,” representing a full unwind of the AI-driven rally.
The confluence between the Head & Shoulders measured move and the $80–85 Fibonacci support strengthens the probability of a deeper correction if the neckline fails.
How Low Could PLTR Go?
The standard Head & Shoulders projection measures the distance from the head to the neckline and projects it downward from the breakdown point. In Palantir’s case, this method targets the $80–90 zone, which aligns almost perfectly with the 38.2% Fibonacci retracement (~$84).
Burry’s annotations suggest that selling pressure may not stop there. In a broader risk-off environment or a full repricing of AI-related valuations, PLTR could extend lower toward the $50–55 range, near the 23.6% Fibonacci level and prior consolidation areas from 2023.
Such a move would represent a 60%+ decline from the peak, consistent with historical drawdowns seen after parabolic, narrative-driven advances.
Why the Bearish Case Makes Sense
Technical Breakdown: A confirmed close below the $145 neckline could trigger stop-losses, systematic selling, and momentum-driven downside.
Valuation Risk: Despite strong growth, Palantir continues to trade at elevated multiples, leaving little margin for disappointment.
Market Context: Broader weakness in tech or a cooling of AI enthusiasm could accelerate the unwind.
Burry’s Playbook: Historically, Burry has focused on identifying late-cycle excesses and positioning for mean reversion, not incremental pullbacks.
Risks to the Bear Case
The bearish scenario would be invalidated if PLTR reclaims the neckline and sustains price action above $155–160. Strong earnings surprises or renewed AI-driven inflows could revive bullish momentum and delay the correction.
Conclusion
Michael Burry’s chart highlights a familiar market story: parabolic upside, distribution at the top, and the risk of a sharp mean reversion. If the Head & Shoulders pattern on Palantir confirms, the technical roadmap points first toward $80, with a potential deeper “landing area” around $50–55.
Nor sold the top after my signal:
Now you need to know Michael Burry’s Bearish Take on Palantir (PLTR): A Head & Shoulders Warning!
Palantir Technologies (PLTR) has been one of the most explosive AI-driven stocks of the past cycle, rallying from pandemic-era lows near $6 in 2022 to an all-time high above $207 in November 2025. However, according to a technical setup recently highlighted by legendary investor Michael Burry, this parabolic advance may now be unwinding.
Burry’s chart points to a classic Head & Shoulders top, a pattern that often marks the transition from euphoria to distribution—and, eventually, to a deeper corrective phase.
Who Is Michael Burry?
Michael Burry is the founder of Scion Asset Management and the investor made famous for predicting and profiting from the 2008 subprime mortgage collapse. His bet against the U.S. housing market was later chronicled in The Big Short, where he was portrayed by Christian Bale.
Burry is widely known for his contrarian approach, focusing on valuation extremes, market psychology, and late-cycle excess. He has frequently warned about speculative bubbles, including tech and AI-related themes, often publishing—and then deleting—brief but highly scrutinized market observations.
The Head & Shoulders Structure on PLTR
On February 10, 2026, Burry shared a chart of Palantir on X (formerly Twitter), annotated with a textbook Head & Shoulders formation:
Left Shoulder: Formed in mid-2025, topping near $150–160, followed by a sharp pullback.
Head: The cycle peak at ~$207 in November 2025, driven by peak AI enthusiasm, index inclusion, and strong earnings momentum.
Right Shoulder: A lower high in early 2026, again near $160–170, failing to reclaim the prior peak—an early sign of trend exhaustion.
Neckline: A key horizontal support zone around $145, now being actively tested.
A decisive break below the neckline typically confirms the pattern and opens the door to accelerated downside pressure.
Fibonacci Levels Confirm the Downside Risk
To assess potential downside targets, Fibonacci retracement levels were drawn from the 2022 low (~$6) to the 2025 high (~$207). These levels align closely with the Head & Shoulders projections:
0.618 retracement: ~$131
An initial bounce zone, already tested during the recent pullback.
0.50 retracement: ~$107
A psychological midpoint, but not a major structural support.
0.382 retracement: ~$84
Next major support, aligning with the classic measured move of the Head & Shoulders pattern.
0.236 retracement: ~$54
The highlighted “landing area,” representing a full unwind of the AI-driven rally.
The confluence between the Head & Shoulders measured move and the $80–85 Fibonacci support strengthens the probability of a deeper correction if the neckline fails.
How Low Could PLTR Go?
The standard Head & Shoulders projection measures the distance from the head to the neckline and projects it downward from the breakdown point. In Palantir’s case, this method targets the $80–90 zone, which aligns almost perfectly with the 38.2% Fibonacci retracement (~$84).
Burry’s annotations suggest that selling pressure may not stop there. In a broader risk-off environment or a full repricing of AI-related valuations, PLTR could extend lower toward the $50–55 range, near the 23.6% Fibonacci level and prior consolidation areas from 2023.
Such a move would represent a 60%+ decline from the peak, consistent with historical drawdowns seen after parabolic, narrative-driven advances.
Why the Bearish Case Makes Sense
Technical Breakdown: A confirmed close below the $145 neckline could trigger stop-losses, systematic selling, and momentum-driven downside.
Valuation Risk: Despite strong growth, Palantir continues to trade at elevated multiples, leaving little margin for disappointment.
Market Context: Broader weakness in tech or a cooling of AI enthusiasm could accelerate the unwind.
Burry’s Playbook: Historically, Burry has focused on identifying late-cycle excesses and positioning for mean reversion, not incremental pullbacks.
Risks to the Bear Case
The bearish scenario would be invalidated if PLTR reclaims the neckline and sustains price action above $155–160. Strong earnings surprises or renewed AI-driven inflows could revive bullish momentum and delay the correction.
Conclusion
Michael Burry’s chart highlights a familiar market story: parabolic upside, distribution at the top, and the risk of a sharp mean reversion. If the Head & Shoulders pattern on Palantir confirms, the technical roadmap points first toward $80, with a potential deeper “landing area” around $50–55.

DAILY HIGH-CONVICTION OPTIONS SIGNALS patreon.com/PremiumOptionsSignals
Options buy freedom24.club/SocialBookTV
RESULTS bit.ly/TG99x
CRYPTOS partner.bybit.com/b/37880
BUY-SELL INDICATORS tradingindicators.store
Options buy freedom24.club/SocialBookTV
RESULTS bit.ly/TG99x
CRYPTOS partner.bybit.com/b/37880
BUY-SELL INDICATORS tradingindicators.store
Related publications
Disclaimer
The information and publications are not meant to be, and do not constitute, financial, investment, trading, or other types of advice or recommendations supplied or endorsed by TradingView. Read more in the Terms of Use.