
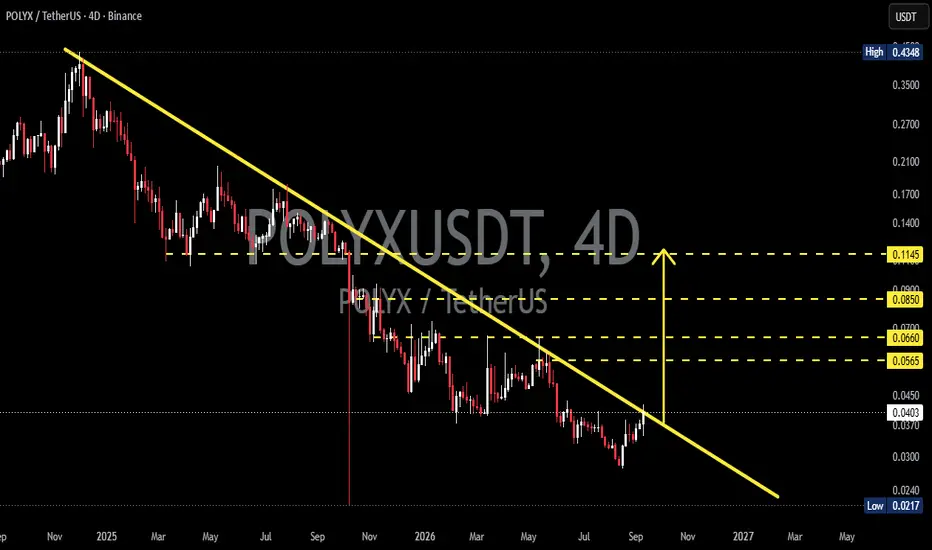
Pair: POLYX/USDT
Time Frame: 4D
Exchange: Binance
Current Price: around $0.0402
🔻 POLYX remains within a long-term downtrend structure, with price trading below the Descending Trendline that has formed since the high around $0.43. This trendline has acted as dynamic resistance and has repeatedly limited upward price movements.
However, the current price is beginning to approach this important trendline area, making a breakout a crucial point for determining a potential trend change.
---
📐 Pattern: Descending Trendline
🔻 A Descending Trendline is a resistance line connecting a series of lower highs. This pattern indicates that sellers remain in control as long as price stays below the trendline.
📉 On this chart, the trendline has strong technical significance because price has been rejected several times when approaching the resistance.
⚠️ As long as there is no valid breakout, the overall structure can still be considered bearish/downtrend.
🚀 However, repeated tests of resistance can potentially weaken that resistance if buyers manage to increase buying pressure.
---
🟢 BULLISH SCENARIO
🚀 The bullish scenario becomes significantly stronger if POLYX breaks above the Descending Trendline and confirms a 4D candle close above it.
📌 Such a breakout would provide an early indication that long-term bearish pressure is beginning to weaken.
🔄 After the breakout, an ideal confirmation would be a retest of the trendline, followed by price successfully holding the former resistance as support.
🎯 If the breakout is confirmed, the key resistance levels shown on the chart become the next potential targets:
🎯 Target 1 — $0.0565
🎯 Target 2 — $0.0660
🎯 Target 3 — $0.0850
🎯 Target 4 — $0.1145
🔥 The $0.0850–$0.1145 area represents a significantly stronger resistance zone. If POLYX reaches and breaks through this zone, the medium-term structure could become considerably more bullish.
📈 Breakout + Retest + Higher High would provide a much stronger confirmation than simply having a wick move above the trendline.
---
🔴 BEARISH SCENARIO
⚠️ If POLYX fails to break the Descending Trendline and experiences another rejection, sellers may still be maintaining control.
📉 A rejection from the trendline could cause price to move back toward the nearest support areas.
🔻 Key areas to watch:
🔸 $0.0370–$0.0400 — Current support/structure
🔸 $0.0300 — Next support area
🔸 $0.0217 — Important low on the chart
🚨 If price breaks back below the $0.0370–$0.0400 area, the probability of bearish continuation would increase.
❌ Under this scenario, the bullish breakout thesis would become weaker, with price potentially returning toward $0.0300 and even the low around $0.0217.
---
🧠 CONCLUSION
📊 POLYX is currently in a technically interesting area.
🔻 Below the Descending Trendline: The structure remains bearish.
🟡 Breakout but not yet confirmed: Wait for a candle close and retest.
🟢 Breakout + Successful Retest: Opens the possibility toward $0.0565 → $0.0660 → $0.0850 → $0.1145.
🔴 Rejection + Support Breakdown: Increases the risk of continuation toward $0.0300 and $0.0217.
🔥 The most important level right now is the Descending Trendline. A valid breakout from this resistance could be an early signal of a potential structural shift from a long-term downtrend → potential bullish reversal.
⚠️ This analysis represents potential technical scenarios and is not financial advice. Always conduct your own research before making any trading decision.
#POLYX #POLYXUSDT #Crypto

✅ Get Free Signals! Join Our Telegram Channel Here: t.me/TheCryptoNuclear
✅ Twitter: twitter.com/crypto_nuclear
✅ Join Bybit : partner.bybit.com/b/nuclearvip
✅ Benefits : Lifetime Trading Fee Discount -50%
✅ Twitter: twitter.com/crypto_nuclear
✅ Join Bybit : partner.bybit.com/b/nuclearvip
✅ Benefits : Lifetime Trading Fee Discount -50%
Disclaimer
The information and publications are not meant to be, and do not constitute, financial, investment, trading, or other types of advice or recommendations supplied or endorsed by TradingView. Read more in the Terms of Use.