Can Bulls Reclaim $70? 🚀
📆 Daily Chart — Macro Structure and Bias
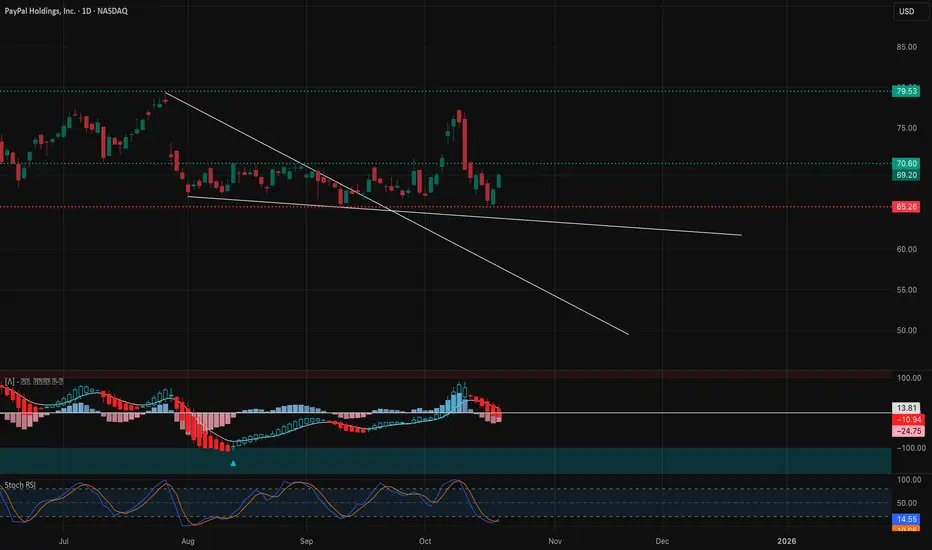
Market Structure: PayPal (PYPL) continues to trade within a broad descending channel but is showing early signs of structural stabilization. After several failed breakdowns, bulls defended the $64.50–$65.00 demand zone — a key level where prior liquidity sweeps triggered reversals. The most recent BOS (Break of Structure) around $69.00 indicates that smart money might be accumulating again within this base range.
We can see multiple CHoCH and BOS interactions suggesting buyers are quietly absorbing supply below $70, preparing for a potential structural shift back toward the mid-channel zone.
Supply & Demand / Order Blocks:
* Major Demand Zone: $64.00–$65.00 (deep OB and liquidity defense).
* Intermediate Supply Zone: $70.50–$71.00 (mid-channel resistance).
* Major Supply Zone: $79.00–$80.00 (top of the previous swing high cluster).
If bulls can maintain daily closes above $68.50, this could evolve into a mid-term reversal attempt toward $75+.
Indicator Confluence:
* 9 EMA vs 21 EMA: Bearish on macro view but flattening — momentum loss from sellers.
* MACD: Histogram is improving from deep negative; a cross above zero could confirm a macro shift.
* Stoch RSI: Rising sharply from oversold (10 → 45), signaling renewed buying strength.
* Volume: Buyer volume expanding near the base, consistent with accumulation phase behavior.
The daily structure remains in a potential bottoming phase; sustained closes above $69.50 will confirm a bullish shift.
⏱️ 1-Hour Chart — Short-Term Trend and Swing Bias

Market Structure: The 1-hour timeframe paints a much clearer bullish microstructure after a decisive CHoCH from the descending wedge. Price reclaimed $67.00, then printed a BOS toward $69.20, completing the first leg of reversal structure.
We’re now consolidating just beneath $69.80–$70.00, which lines up with the mid-term supply zone and a key call wall on the GEX chart. The structure remains bullish as long as $68.00 holds as a higher low.
Supply & Demand / OB Zones:
* Demand Zone: $67.00–$68.00 (recent breakout OB).
* Supply Zone: $69.80–$70.50 (local resistance and liquidity pocket).
Indicator Confluence:
* 9 EMA > 21 EMA — clear bullish alignment, steep slope.
* MACD: Strong expansion with rising histogram, supporting upward bias.
* Stoch RSI: Hovering at 80+ — slightly overheated, but not reversing yet.
* Volume: Increasing on breakouts, declining during pullbacks — healthy pattern.
Trade Scenarios:
* Bullish Setup: Buy dips near $68.20–$68.50 → Target $70.00 / $71.00 → Stop $67.20.
* Bearish Setup: If rejection from $70.50 with divergence → Short to $68.00 / $67.00 → Stop $71.00.
If PYPL breaks and closes above $70, it will invalidate short setups and start targeting $72.50–$73.50 next.
🕒 15-Minute Chart — Intraday Momentum and Scalping Zones

Market Structure: The 15-minute chart confirms strong short-term bullish control with stacked BOS and higher-low formations. Price is trending neatly along the rising intraday trendline, using the 9 EMA as dynamic support. Each micro pullback toward $68.80–$69.00 has been aggressively defended.
Supply & Demand / OB Levels:
* Demand Zone: $68.60–$68.80 (scalp OB and trendline support).
* Supply Zone: $69.80–$70.20 (intraday resistance + liquidity sweep potential).
Indicator Confluence:
* 9 EMA vs 21 EMA: Strong bullish slope; 9 EMA acting as perfect bounce line.
* MACD: Histogram slightly flattening after expansion — possible short-term cool-off.
* Stoch RSI: Overbought (>80), indicating potential short-term pause before continuation.
Scalp Plan:
* Bullish Bias: Enter near $68.80 pullback → Target $69.80 / $70.20 → Stop below $68.20.
* Bearish Bias: If $70 rejects twice with fading MACD momentum → Short scalp to $68.80 → Stop $70.40.
Intraday bias stays bullish unless price closes below $68.50 — that would mark short-term exhaustion.
📊 GEX (Gamma Exposure) & Options Sentiment Overview

PYPL’s options structure shows a neutral-to-bullish gamma setup with dealers likely positioned to stabilize price between $66–$70. The highest positive NET GEX sits around $70, effectively pinning current price in a tight gamma range.
Key GEX Levels:
* Highest Positive Gamma: $70.00 (dealer magnet).
* Major Call Walls: $72.00 and $74.00 — resistance zones if momentum expands.
* Put Support: $65.00 and $64.00 — strong floor if pullback occurs.
* IVR: 58.6 — elevated but not extreme, indicating active trader participation.
* Call Flow: 35.2% (muted but rising), suggesting cautious optimism.
If price sustains above $70.00, dealer hedging could flip to positive gamma expansion, pressing for a gradual melt-up toward $73–$74. A rejection below $68.00, however, might trigger delta-neutral unwind and short-term reversion to $65.
🎯 Closing Outlook
PYPL enters the week with a constructive recovery tone. The broader daily structure suggests a possible bottoming phase, while the intraday trend shows active buyer defense near $68. The GEX map supports a magnetized range between $68–$70, with potential gamma breakout if momentum persists midweek.
I’m watching for a decisive daily close above $70 — if bulls manage that, $72.50–$74 could be in play before the week ends. Below $68, expect a controlled retest toward $65 before another attempt higher.
Disclaimer: This analysis is for educational purposes only and not financial advice. Always do your own research and manage your risk.
📆 Daily Chart — Macro Structure and Bias
Market Structure: PayPal (PYPL) continues to trade within a broad descending channel but is showing early signs of structural stabilization. After several failed breakdowns, bulls defended the $64.50–$65.00 demand zone — a key level where prior liquidity sweeps triggered reversals. The most recent BOS (Break of Structure) around $69.00 indicates that smart money might be accumulating again within this base range.
We can see multiple CHoCH and BOS interactions suggesting buyers are quietly absorbing supply below $70, preparing for a potential structural shift back toward the mid-channel zone.
Supply & Demand / Order Blocks:
* Major Demand Zone: $64.00–$65.00 (deep OB and liquidity defense).
* Intermediate Supply Zone: $70.50–$71.00 (mid-channel resistance).
* Major Supply Zone: $79.00–$80.00 (top of the previous swing high cluster).
If bulls can maintain daily closes above $68.50, this could evolve into a mid-term reversal attempt toward $75+.
Indicator Confluence:
* 9 EMA vs 21 EMA: Bearish on macro view but flattening — momentum loss from sellers.
* MACD: Histogram is improving from deep negative; a cross above zero could confirm a macro shift.
* Stoch RSI: Rising sharply from oversold (10 → 45), signaling renewed buying strength.
* Volume: Buyer volume expanding near the base, consistent with accumulation phase behavior.
The daily structure remains in a potential bottoming phase; sustained closes above $69.50 will confirm a bullish shift.
⏱️ 1-Hour Chart — Short-Term Trend and Swing Bias
Market Structure: The 1-hour timeframe paints a much clearer bullish microstructure after a decisive CHoCH from the descending wedge. Price reclaimed $67.00, then printed a BOS toward $69.20, completing the first leg of reversal structure.
We’re now consolidating just beneath $69.80–$70.00, which lines up with the mid-term supply zone and a key call wall on the GEX chart. The structure remains bullish as long as $68.00 holds as a higher low.
Supply & Demand / OB Zones:
* Demand Zone: $67.00–$68.00 (recent breakout OB).
* Supply Zone: $69.80–$70.50 (local resistance and liquidity pocket).
Indicator Confluence:
* 9 EMA > 21 EMA — clear bullish alignment, steep slope.
* MACD: Strong expansion with rising histogram, supporting upward bias.
* Stoch RSI: Hovering at 80+ — slightly overheated, but not reversing yet.
* Volume: Increasing on breakouts, declining during pullbacks — healthy pattern.
Trade Scenarios:
* Bullish Setup: Buy dips near $68.20–$68.50 → Target $70.00 / $71.00 → Stop $67.20.
* Bearish Setup: If rejection from $70.50 with divergence → Short to $68.00 / $67.00 → Stop $71.00.
If PYPL breaks and closes above $70, it will invalidate short setups and start targeting $72.50–$73.50 next.
🕒 15-Minute Chart — Intraday Momentum and Scalping Zones
Market Structure: The 15-minute chart confirms strong short-term bullish control with stacked BOS and higher-low formations. Price is trending neatly along the rising intraday trendline, using the 9 EMA as dynamic support. Each micro pullback toward $68.80–$69.00 has been aggressively defended.
Supply & Demand / OB Levels:
* Demand Zone: $68.60–$68.80 (scalp OB and trendline support).
* Supply Zone: $69.80–$70.20 (intraday resistance + liquidity sweep potential).
Indicator Confluence:
* 9 EMA vs 21 EMA: Strong bullish slope; 9 EMA acting as perfect bounce line.
* MACD: Histogram slightly flattening after expansion — possible short-term cool-off.
* Stoch RSI: Overbought (>80), indicating potential short-term pause before continuation.
Scalp Plan:
* Bullish Bias: Enter near $68.80 pullback → Target $69.80 / $70.20 → Stop below $68.20.
* Bearish Bias: If $70 rejects twice with fading MACD momentum → Short scalp to $68.80 → Stop $70.40.
Intraday bias stays bullish unless price closes below $68.50 — that would mark short-term exhaustion.
📊 GEX (Gamma Exposure) & Options Sentiment Overview
PYPL’s options structure shows a neutral-to-bullish gamma setup with dealers likely positioned to stabilize price between $66–$70. The highest positive NET GEX sits around $70, effectively pinning current price in a tight gamma range.
Key GEX Levels:
* Highest Positive Gamma: $70.00 (dealer magnet).
* Major Call Walls: $72.00 and $74.00 — resistance zones if momentum expands.
* Put Support: $65.00 and $64.00 — strong floor if pullback occurs.
* IVR: 58.6 — elevated but not extreme, indicating active trader participation.
* Call Flow: 35.2% (muted but rising), suggesting cautious optimism.
If price sustains above $70.00, dealer hedging could flip to positive gamma expansion, pressing for a gradual melt-up toward $73–$74. A rejection below $68.00, however, might trigger delta-neutral unwind and short-term reversion to $65.
🎯 Closing Outlook
PYPL enters the week with a constructive recovery tone. The broader daily structure suggests a possible bottoming phase, while the intraday trend shows active buyer defense near $68. The GEX map supports a magnetized range between $68–$70, with potential gamma breakout if momentum persists midweek.
I’m watching for a decisive daily close above $70 — if bulls manage that, $72.50–$74 could be in play before the week ends. Below $68, expect a controlled retest toward $65 before another attempt higher.
Disclaimer: This analysis is for educational purposes only and not financial advice. Always do your own research and manage your risk.
Trade active
Mid Day Session Update — Oct 21PYPL is holding strong above $70, riding the trendline cleanly after a solid BOS breakout this morning. Momentum cooled off slightly after tagging $70.60, but overall structure still leans bullish.
➡️ Support: 69.80 → 69.20
➡️ Resistance: 70.60 → 71.00
MACD showing a minor fade but still above zero — healthy pullback vibes, not full reversal yet.
As long as PYPL stays above $69.80, bulls are in control. Watch for another push toward $71+ if buyers defend the trendline.
Trade closed: target reached
Intraday Update (Oct 24)Price is attempting to stabilize after a sharp morning pullback from the BOS region near $71.5. Buyers stepped in around the $69.7–$70 demand zone, defending the structure for now and forming a short-term base.
* Current Price: $70.47
* Structure: Still within a rising channel but showing signs of a temporary retracement phase.
* CHoCH Zone: Around $69.8 — remains the key support to maintain bullish bias.
* BOS Confirmation: The previous Break of Structure near $71.2–$71.5** defines the upper boundary for potential rebound targets.
* MACD: Starting to shift back toward the zero line, showing early signs of bullish momentum recovery after a cooling phase.
* Stochastic RSI: Rising from the oversold zone — could fuel a short-term bounce if momentum continues to build.
Key Levels to Watch
* Immediate Resistance: $71.20 → $71.50
* Support Zone: $69.70 → $69.30
* Breakdown Risk: A move below $69.3 may invalidate the structure and test $68.8–$68.5 liquidity area.
The structure is still constructive within the rising channel, but momentum remains fragile. If $69.7 holds, expect a push back toward $71.2–$71.5 to retest the prior BOS level. However, a failure to hold above $70 could lead to a retest of the lower demand block near $69.3 before any further upside attempt.
Disclaimer
The information and publications are not meant to be, and do not constitute, financial, investment, trading, or other types of advice or recommendations supplied or endorsed by TradingView. Read more in the Terms of Use.
Disclaimer
The information and publications are not meant to be, and do not constitute, financial, investment, trading, or other types of advice or recommendations supplied or endorsed by TradingView. Read more in the Terms of Use.