 BTCUSD
 TOTAL
 PYUSD.D
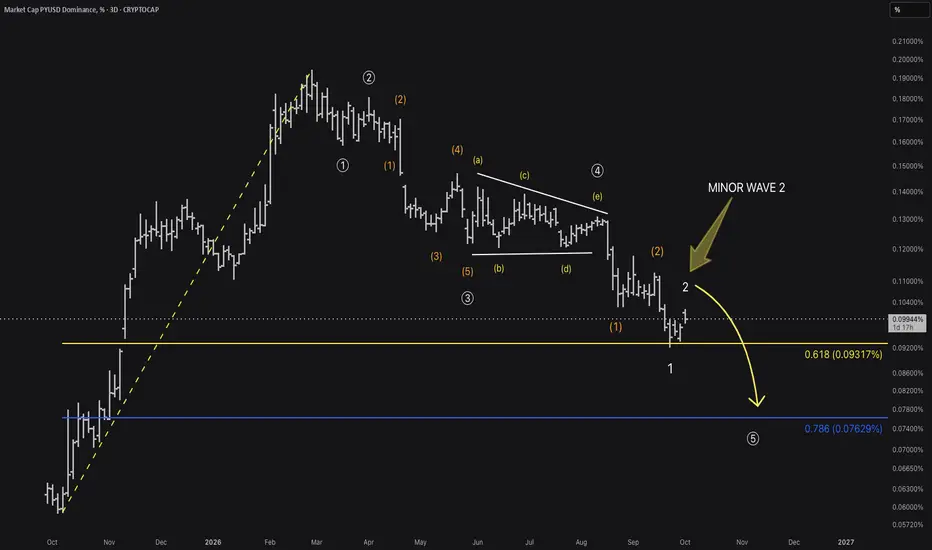
: a fairly new stable coin that can offer signals in crypto, similar to USDT.D and USDC.D. This chart can be a useful momentum indicator, being that it moves in reverse/inverse correlation against TOTAL. Wave counts and structure can get a bit ugly when looking at TOTAL or something like BTC. However, taking a gander at stablecoin charts can often show a little more light.
Taking a Look at Structure
What stands out to me most in this chart is the large, sideways action, triangle formation. This suggests either a B,X, or 4th wave. So, it would be fair to mark that area as primary wave 4. Afterward, we can see that primary wave 5 down is printing, and so far, dominance has retraced to the 0.618 level of the entire trend up. This area is well known for support as well as reversals. But, taking a look at the wave count, evidence could suggest even further retracement to the downside.
Wave Count
It appears that primary wave 5 is still in effect and subdividing into lower degrees (extended 5th wave). The evidence is that the bounce from the 0.618 cannot be labeled as intermediate wave (3) of primary wave 5 because intermediate wave (3) cannot be the shortest. So, this may suggest that a minor wave 1 has printed at that 0.618 ratio; a subdivision into a lower degree. An alternative to this wave count would be that primary wave 5 could be an ending diagonal. Either way, further retracement down can be expected. Let's zoom in and take a better look at whats going on in lower time frame at the presumed minor wave 1 and incomplete 2.
1HR Chart
We can see from minor wave 1 that a 5 wave impulse up forms yellow A, followed by what appears to be an expanding triangle that forms yellow B. And now it looks like another 5 wave impulse is moving up that could print yellow C, which potentially marks minor wave 2. I say potentially with the possibility that yellow C could mark W (a continuation of correction). I have a 1:1.618 ( wave (i) × 1.618) plotted that could potentially mark wave (v) terminal of the impulse. If this tops out there, it may again become impulsive to the downside.
What does this suggest? TL:DR
As primary wave 5 subdivides into smaller degrees, we could very well experience wave 3 of (3) of primary wave 5; an area that could drop lower than anticipated which leads to more waves up throughout crypto assets. The 0.786 ratio @ .07629 could provide support and the possibility of a bounce. Are you expecting something different? Share your thoughts and TA. Thanks, and good luck!

Disclaimer
The information and publications are not meant to be, and do not constitute, financial, investment, trading, or other types of advice or recommendations supplied or endorsed by TradingView. Read more in the Terms of Use.
Disclaimer
The information and publications are not meant to be, and do not constitute, financial, investment, trading, or other types of advice or recommendations supplied or endorsed by TradingView. Read more in the Terms of Use.