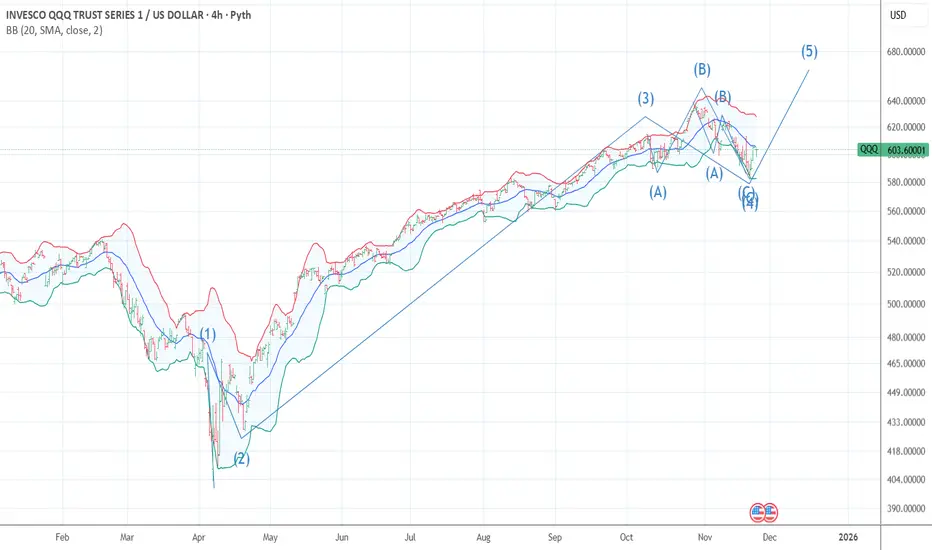
The chart posted below is my Alt bullish wave structure we can count it two ways first it was a simple zig zag down from 639 to 580 a 9.3 % decline and an ABC flat also 9.3 % decline I will look for a 14.3 % rally off the low of 580 zone It should take about 15 TD to form the Blowoff top based on Put /call models and NASI forming support in the minus -500 zone over the last 5 years . and the HIGH QQQ VIX VXN . I have moved back again into a position long calls mid year 2027 Only as we are at downtrend lines in qqqe qqqj and rsp as of this post I alos have major support in IGV now
Disclaimer
The information and publications are not meant to be, and do not constitute, financial, investment, trading, or other types of advice or recommendations supplied or endorsed by TradingView. Read more in the Terms of Use.
Disclaimer
The information and publications are not meant to be, and do not constitute, financial, investment, trading, or other types of advice or recommendations supplied or endorsed by TradingView. Read more in the Terms of Use.