11.25INR
352.26 MINR
2.54 BINR
7.07 M
About RUBY MILLS
Sector
Industry
CEO
Purav Hiren Shah
Website
Headquarters
Mumbai
Employees (FY)
191
Founded
1917
ISIN
INE301D01026
FIGI
BBG000CYTT88
Ruby Mills Ltd. engages in the manufacturing of textile and renting of properties. It operates through the Textile and Real Estate segment. Its products include fabrics, industrial textiles, institutional supply, functional textiles, and fancy fabrics. The company was founded in 1917 and is headquartered in Mumbai, India.

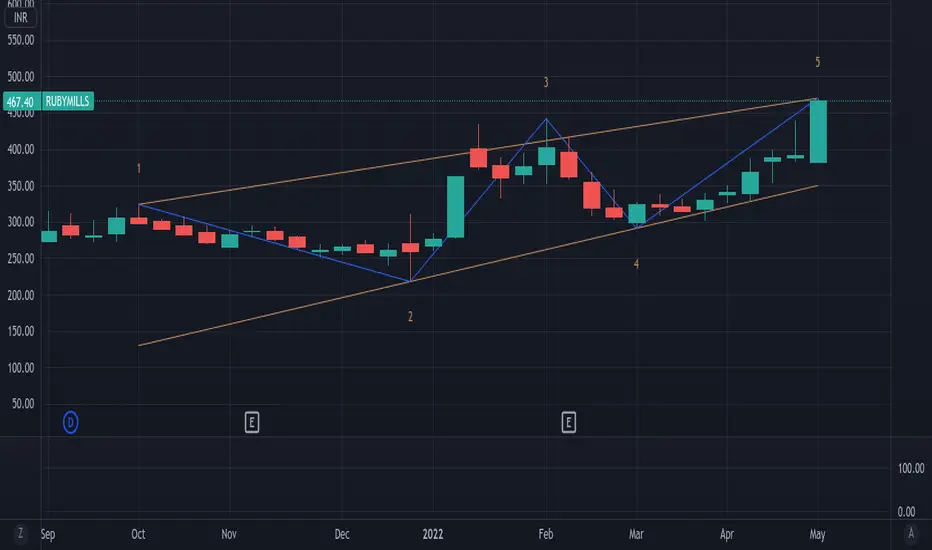
ruby mills watch for channel breakoutchannel breakout on weekly charts
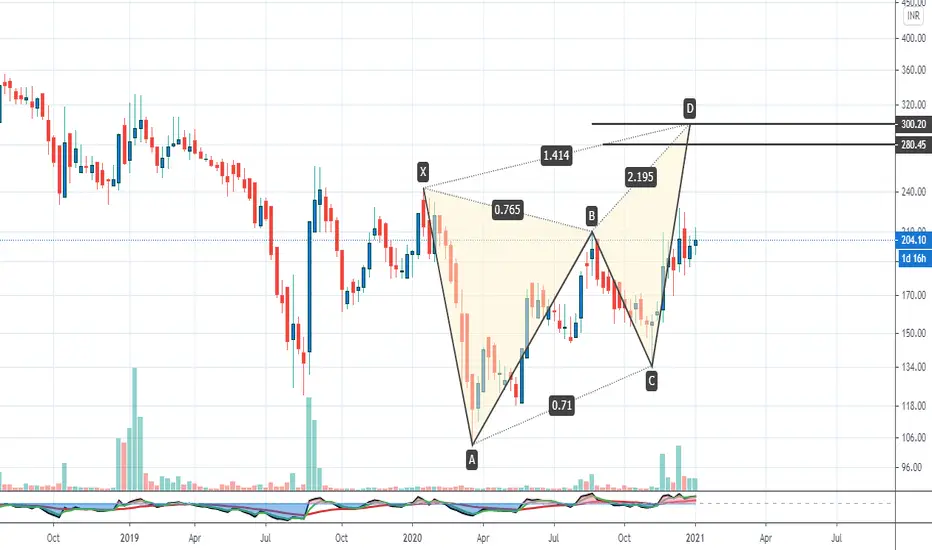
rounding pattern on daily charts
no excessive debt , intrinsic value high
p/e 25 , revenue not stable
for education purposes only
Rubby Mills IndiaSun Storm Investment Trading Desk & NexGen Wealth Management Service Present's: SSITD & NexGen Portfolio of the Week Series
Focus: Worldwide
By Sun Storm Investment Research & NexGen Wealth Management Service
A Profit & Solutions Strategy & Research
Trading | Investment | Stocks | ETF | Mutua

RUBY MILLSBreakout. Targets 318-320. Sl 290.
Above ideas are for educational purposes only, kindly consult your financial advisor before investing.
Please don’t forget to like and subscribe if you like the idea.

See all ideas
Trade directly on the supercharts through our supported, fully-verified and user-reviewed brokers.


Frequently Asked Questions
The current price of RUBYMILLS is 197.75 INR — it has decreased by 0.53% in the past 24 hours.
Depending on the exchange, the stock ticker may vary. For instance, on NSE exchange RUBY MILLS stocks are traded under the ticker RUBYMILLS.
RUBY MILLS is going to release the next earnings report on May 29, 2024. Keep track of upcoming events with our Earnings Calendar.
RUBYMILLS stock is 3.63% volatile and has beta coefficient of 0.89. Check out the list of the most volatile stocks — is RUBY MILLS there?
Yes, you can track RUBY MILLS financials in yearly and quarterly reports right on TradingView.
RUBYMILLS stock has fallen by 6.06% compared to the previous week, the month change is a 3.05% rise, over the last year RUBY MILLS has showed a 4.52% increase.
RUBYMILLS net income for the last quarter is 110.91 M INR, while the quarter before that showed 80.69 M INR of net income which accounts for 37.44% change. Track more RUBY MILLS financial stats to get the full picture.
Today RUBY MILLS has the market capitalization of 6.62 B, it has increased by 1.95% over the last week.
Yes, RUBYMILLS dividends are paid annually. The last dividend per share was 1.25 INR. As of today, Dividend Yield (TTM)% is 0.63%. Tracking RUBY MILLS dividends might help you take more informed decisions.
RUBY MILLS dividend yield was 0.83% in 2022, and payout ratio reached 11.87%. The year before the numbers were 0.93% and 16.16% correspondingly. See high-dividend stocks and find more opportunities for your portfolio.
Like other stocks, RUBYMILLS shares are traded on stock exchanges, e.g. Nasdaq, Nyse, Euronext, and the easiest way to buy them is through an online stock broker. To do this, you need to open an account and follow a broker's procedures, then start trading. You can trade RUBY MILLS stock right from TradingView charts — choose your broker and connect to your account.
As of Apr 19, 2024, the company has 191.00 employees. See our rating of the largest employees — is RUBY MILLS on this list?
Investing in stocks requires a comprehensive research: you should carefully study all the available data, e.g. company's financials, related news, and its technical analysis. So RUBY MILLS technincal analysis shows the sell today, and its 1 week rating is sell. Since market conditions are prone to changes, it's worth looking a bit further into the future — according to the 1 month rating RUBY MILLS stock shows the neutral signal. See more of RUBY MILLS technicals for a more comprehensive analysis.
If you're still not sure, try looking for inspiration in our curated watchlists.
If you're still not sure, try looking for inspiration in our curated watchlists.
EBITDA measures a company's operating performance, its growth signifies an improvement in the efficiency of a company. RUBY MILLS EBITDA is 509.94 M INR, and current EBITDA margin is 18.57%. See more stats in RUBY MILLS financial statements.