
📌 Pair:  SFP
⏳ Time Frame: 3D
📍 Current Price: around 0.3077 USDT
📐 Pattern: Descending Trendline / Downtrend Resistance
---
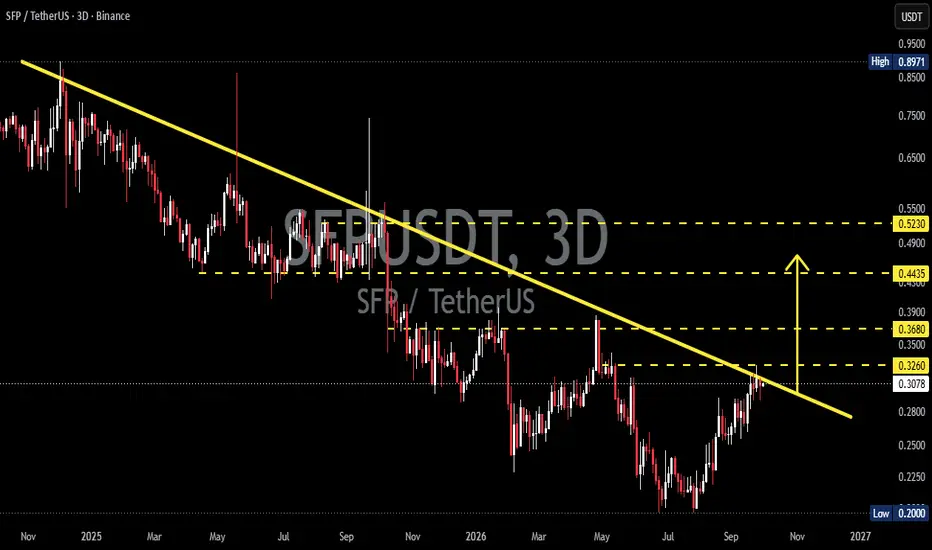
🔻 Descending Trendline Structure
📉 The chart shows that SFP has been moving within a long-term downtrend, forming a series of Lower Highs (LH) connected by the descending yellow trendline.
🔎 The Descending Trendline acts as dynamic resistance. As long as price remains below this trendline, bearish pressure remains dominant.
However, price has now returned to test this trendline after rebounding from the 0.20 USDT area.
⚠️ The 0.30–0.326 USDT zone is critical, as it represents the intersection of the current price area, descending trendline, and horizontal resistance.
---
🟢 BULLISH SCENARIO
🚀 The bullish scenario becomes more valid if SFP successfully breaks above the descending trendline and holds above it.
🎯 Bullish Levels:
1️⃣ 0.326 USDT — Initial Breakout Zone
📈 A breakout and 3D close above this area could provide an early indication that selling pressure from the descending trendline is weakening.
2️⃣ 0.368 USDT — Next Resistance
🔥 If 0.326 is reclaimed as support, price could potentially move toward the next resistance at 0.368 USDT.
3️⃣ 0.4435 USDT — Major Resistance
🚀 This is an important horizontal resistance area. A breakout above this level could further strengthen the bullish structure and open the way toward higher resistance levels.
4️⃣ 0.5230 USDT — Major Target / Resistance
🎯 If bullish momentum continues, 0.523 USDT becomes the next major resistance on the chart.
📊 From approximately 0.3077 USDT, these levels represent roughly +6%, +20%, +44%, and +70% potential price movement, respectively.
> ⚠️ These percentages represent price-distance calculations and are not a guarantee that the targets will be reached.
---
🔴 BEARISH SCENARIO
⚠️ The bearish scenario remains valid if SFP is rejected by the descending trendline and fails to hold the breakout area.
If rejection occurs:
🔻 0.28 USDT
➡️ The nearest support to monitor if price loses momentum.
🔻 0.25 USDT
➡️ If selling pressure intensifies, price could potentially retest this area.
🔻 0.20 USDT
🚨 This is the major support / recent low clearly visible on the chart. Losing this area could indicate that the longer-term bearish structure remains dominant.
---
🧠 Pattern Explanation — Descending Trendline
📐 A Descending Trendline forms when price consistently creates lower highs, with these highs connected to create a downward-sloping resistance line.
On the SFP chart:
🔴 Lower Highs → indicate that sellers remain active at progressively lower levels.
📉 Descending Trendline → acts as dynamic resistance.
🟡 Horizontal Resistance → provides several important confirmation levels.
🟢 Rebound from 0.20 USDT → indicates a buyer response from the low area.
🚀 Trendline Breakout → could signal a structural shift if confirmed by a candle close and follow-through.
---
🔑 KEY LEVELS TO WATCH
🟢 Bullish Confirmation:
0.326 → 0.368 → 0.4435 → 0.523 USDT
🔴 Bearish Support:
0.28 → 0.25 → 0.20 USDT
📌 Key Point:
SFP is currently at an important technical area as price tests a long-term descending trendline. The market's reaction around this trendline could determine whether the current rebound develops into a trend reversal or remains a relief rally within the broader bearish structure.
---
🎯 Conclusion
📊 SFP/USDT is currently at a critical technical point.
🚀 Breakout + 3D close above the descending trendline and 0.326 USDT → would strengthen the bullish structure, with attention toward 0.368 → 0.4435 → 0.523 USDT.
🔻 Rejection from the trendline + loss of 0.28 USDT → would increase the risk of a retracement toward 0.25, with 0.20 USDT remaining the major support.
⚠️ Breakout confirmation is more important than simply having a wick above the trendline, as false breakouts can still occur.
#SFP #SFPUSDT #SafePal #Crypto
SFP⏳ Time Frame: 3D
📍 Current Price: around 0.3077 USDT
📐 Pattern: Descending Trendline / Downtrend Resistance
---
🔻 Descending Trendline Structure
📉 The chart shows that SFP has been moving within a long-term downtrend, forming a series of Lower Highs (LH) connected by the descending yellow trendline.
🔎 The Descending Trendline acts as dynamic resistance. As long as price remains below this trendline, bearish pressure remains dominant.
However, price has now returned to test this trendline after rebounding from the 0.20 USDT area.
⚠️ The 0.30–0.326 USDT zone is critical, as it represents the intersection of the current price area, descending trendline, and horizontal resistance.
---
🟢 BULLISH SCENARIO
🚀 The bullish scenario becomes more valid if SFP successfully breaks above the descending trendline and holds above it.
🎯 Bullish Levels:
1️⃣ 0.326 USDT — Initial Breakout Zone
📈 A breakout and 3D close above this area could provide an early indication that selling pressure from the descending trendline is weakening.
2️⃣ 0.368 USDT — Next Resistance
🔥 If 0.326 is reclaimed as support, price could potentially move toward the next resistance at 0.368 USDT.
3️⃣ 0.4435 USDT — Major Resistance
🚀 This is an important horizontal resistance area. A breakout above this level could further strengthen the bullish structure and open the way toward higher resistance levels.
4️⃣ 0.5230 USDT — Major Target / Resistance
🎯 If bullish momentum continues, 0.523 USDT becomes the next major resistance on the chart.
📊 From approximately 0.3077 USDT, these levels represent roughly +6%, +20%, +44%, and +70% potential price movement, respectively.
> ⚠️ These percentages represent price-distance calculations and are not a guarantee that the targets will be reached.
---
🔴 BEARISH SCENARIO
⚠️ The bearish scenario remains valid if SFP is rejected by the descending trendline and fails to hold the breakout area.
If rejection occurs:
🔻 0.28 USDT
➡️ The nearest support to monitor if price loses momentum.
🔻 0.25 USDT
➡️ If selling pressure intensifies, price could potentially retest this area.
🔻 0.20 USDT
🚨 This is the major support / recent low clearly visible on the chart. Losing this area could indicate that the longer-term bearish structure remains dominant.
---
🧠 Pattern Explanation — Descending Trendline
📐 A Descending Trendline forms when price consistently creates lower highs, with these highs connected to create a downward-sloping resistance line.
On the SFP chart:
🔴 Lower Highs → indicate that sellers remain active at progressively lower levels.
📉 Descending Trendline → acts as dynamic resistance.
🟡 Horizontal Resistance → provides several important confirmation levels.
🟢 Rebound from 0.20 USDT → indicates a buyer response from the low area.
🚀 Trendline Breakout → could signal a structural shift if confirmed by a candle close and follow-through.
---
🔑 KEY LEVELS TO WATCH
🟢 Bullish Confirmation:
0.326 → 0.368 → 0.4435 → 0.523 USDT
🔴 Bearish Support:
0.28 → 0.25 → 0.20 USDT
📌 Key Point:
SFP is currently at an important technical area as price tests a long-term descending trendline. The market's reaction around this trendline could determine whether the current rebound develops into a trend reversal or remains a relief rally within the broader bearish structure.
---
🎯 Conclusion
📊 SFP/USDT is currently at a critical technical point.
🚀 Breakout + 3D close above the descending trendline and 0.326 USDT → would strengthen the bullish structure, with attention toward 0.368 → 0.4435 → 0.523 USDT.
🔻 Rejection from the trendline + loss of 0.28 USDT → would increase the risk of a retracement toward 0.25, with 0.20 USDT remaining the major support.
⚠️ Breakout confirmation is more important than simply having a wick above the trendline, as false breakouts can still occur.
#SFP #SFPUSDT #SafePal #Crypto

✅ Get Free Signals! Join Our Telegram Channel Here: t.me/TheCryptoNuclear
✅ Twitter: twitter.com/crypto_nuclear
✅ Join Bybit : partner.bybit.com/b/nuclearvip
✅ Benefits : Lifetime Trading Fee Discount -50%
✅ Twitter: twitter.com/crypto_nuclear
✅ Join Bybit : partner.bybit.com/b/nuclearvip
✅ Benefits : Lifetime Trading Fee Discount -50%
Disclaimer
The information and publications are not meant to be, and do not constitute, financial, investment, trading, or other types of advice or recommendations supplied or endorsed by TradingView. Read more in the Terms of Use.
✅ Get Free Signals! Join Our Telegram Channel Here: t.me/TheCryptoNuclear
✅ Twitter: twitter.com/crypto_nuclear
✅ Join Bybit : partner.bybit.com/b/nuclearvip
✅ Benefits : Lifetime Trading Fee Discount -50%
✅ Twitter: twitter.com/crypto_nuclear
✅ Join Bybit : partner.bybit.com/b/nuclearvip
✅ Benefits : Lifetime Trading Fee Discount -50%
Disclaimer
The information and publications are not meant to be, and do not constitute, financial, investment, trading, or other types of advice or recommendations supplied or endorsed by TradingView. Read more in the Terms of Use.