
I liked today’s action a lot.
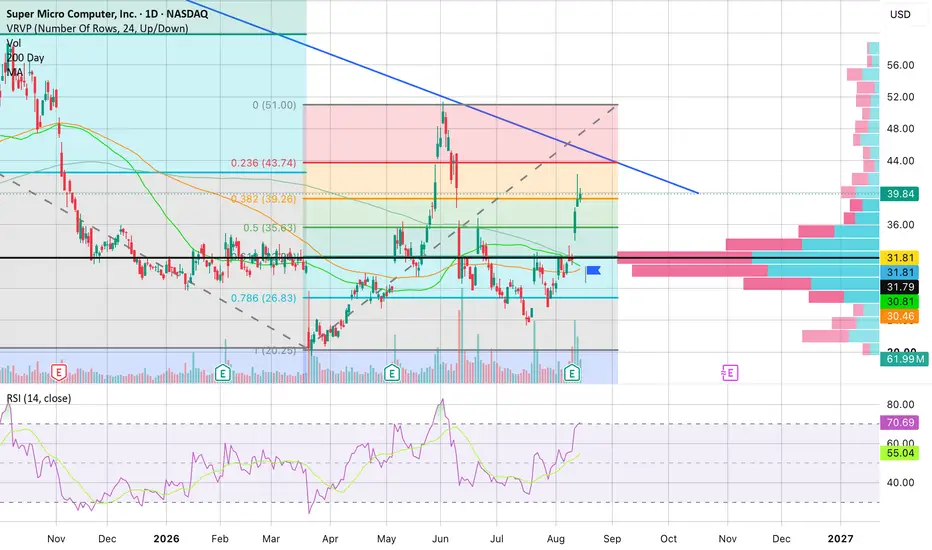
SMCI closed at $39.84 (+1.74%) on roughly 62M shares while much of the broader market finished red. That relative strength stands out, especially following the recent earnings-driven breakout.
The biggest technical takeaway for me is that $38.50 held.
SMCI traded down to $38.74, found buyers, reclaimed $39, and closed back near $40 without giving back much of the breakout. That makes $38.50 my tactical line in the sand going into Monday.
There’s also an important MA setup developing here: SEE BLUE FLAG
The 20 (green), 50 (orange), and 200-day moving averages (blue) are converging
The 50-day is approaching the 200-day
A potential golden cross looks increasingly close ***
That kind of MA compression can become very important if price continues holding above the cluster and momentum expands.
My roadmap:
Above $38.50: bullish structure remains intact
Break $40.60: opens another push higher
$42.25–42.50: next major confirmation zone
Break $42.50: $47 becomes the next meaningful upside target (would be first major TP)
On the downside:
Lose $38.50: $35–36 likely comes back into play. LH / LL structure could be established. Seems unlikely.
RSI is also showing strong momentum, so I would prefer to see price hold these gains rather than immediately overextend.
What I like most is the relative strength. SMCI didn’t need a strong market backdrop to hold the breakout today.
Going into Monday, I’m bullish above $38.50, more aggressive above $40.60, and looking for real confirmation through $42.50.

Disclaimer
The information and publications are not meant to be, and do not constitute, financial, investment, trading, or other types of advice or recommendations supplied or endorsed by TradingView. Read more in the Terms of Use.
Disclaimer
The information and publications are not meant to be, and do not constitute, financial, investment, trading, or other types of advice or recommendations supplied or endorsed by TradingView. Read more in the Terms of Use.