
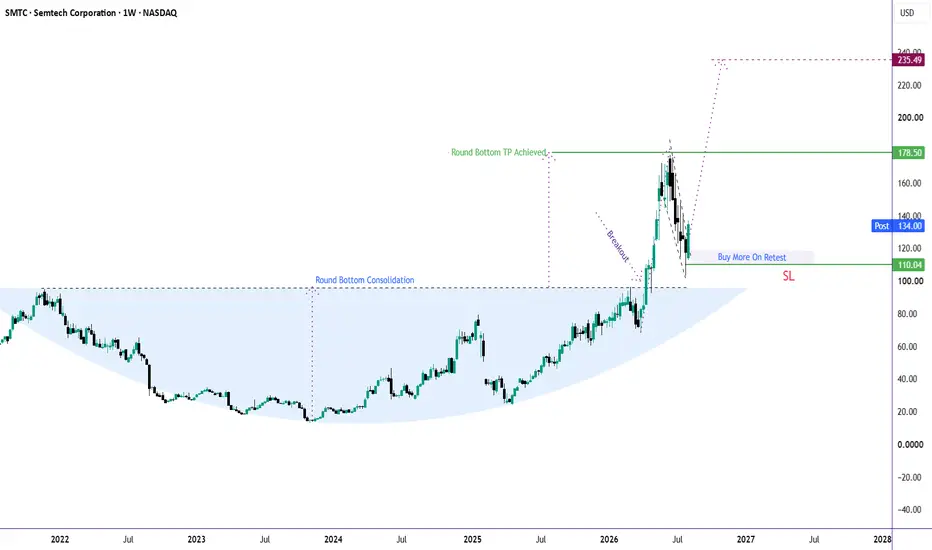
After completing a multi-year Round Bottom and achieving its initial measured target, Semtech (SMTC) appears to be setting up for the next leg higher.
The recent pullback has developed into a large bullish flag, and price is now attempting to break out while holding above the prior breakout zone—a textbook continuation pattern.
📊 Technical Outlook
🟢 Round Bottom breakout already confirmed
🟢 Bull Flag breakout in progress
🟢 Retest holding above major support
🎯 Target 1: Previous swing high near 180
🚀 A decisive breakout above 180 could open the path toward the next measured objective around 235.
🛑 Invalidation: Weekly close below 110.
💡 Fundamental Tailwinds
Semtech's transformation over the past year has been driven by much more than technicals.
⚡ AI Data Center Infrastructure
Semtech has become a key supplier of high-speed signal integrity and optical interconnect solutions used in next-generation AI data centers. As hyperscalers continue expanding GPU clusters, demand for 800G, 1.6T and future 3.2T connectivity remains a major long-term growth driver.
📈 Business Momentum
Recent results showed:
Record annual revenue
Improving margins
Strong operating cash flow
Continued balance-sheet improvement
Management remains confident that AI infrastructure investment will continue supporting growth over the coming quarters.
🎯 Trading Plan
📌 Pattern: Bull Flag Continuation
📌 Bias: Bullish above 110
🎯 Target 1: 180
🚀 Target 2: 200
🚀🚀 Final Target : 235
🛑 Stop Loss: Weekly close below 110
As always, this is a technical setup supported by improving fundamentals—not a guarantee.
Trade active
thats what a bullflag breakout feels like.Note
Entering the retest zone marked.Note
Retest and Rebound- Good earnings- should go higher.Note
Breaking 155 will be a good sign.Note
SMTC continues to rise. reaching strong resistance zone. I will close half position here and leave the remaining half open with SL 155. Note
And here we are, amazing rally captured. Here I will be booking some profits. and hold the rest in anticipation for a breakout and higher rally.Note
thats a weekly breakout of all time high. Amazing outlook. I would be looking at 199-200 before it cools down.Would keep holding and watch for a retest of 170-178 for a new buying opportunity. Shouldn't close below 170 otherwise deeper pullback can begin. for now, 
📊 Charts → 🏗️ Structure → 🎯 Probability =📖 Chart Story
⏳ Patience → 🚀Success
🎯 If this setup makes sense to you, show it some support with a Boost.
⏳ Patience → 🚀Success
🎯 If this setup makes sense to you, show it some support with a Boost.
Disclaimer
The information and publications are not meant to be, and do not constitute, financial, investment, trading, or other types of advice or recommendations supplied or endorsed by TradingView. Read more in the Terms of Use.