
⚠️ ANALYTICAL METHODOLOGY: READ FIRST ⚠️
This analysis utilizes a 100% VOLUME-BASED ALGORITHM powered by Lower Timeframe (LTF) intrabar data. unlike standard Price Action, we are scanning the internal structure of every candle to pinpoint liquidity.
📊 DATA PRECISION USED:
For this specific SOL/USD reading, the system is running on 1S (1-Second) data resolution. This ensures that the Support/Resistance zones shown below are derived from real-time volume distribution, not just visual highs and lows.
💡 WHY THIS MATTERS:
Standard charts hide the battle between buyers and sellers. By using intrabar volume geometry, we filter out the noise and only focus on where the "Smart Money" is actually defending positions.
SOLUSD: Trapped in the "Dead Center" Liquidity Void 📉
Most traders guess where the breakout will happen. The math suggests we are currently in a "No-Trade Zone."
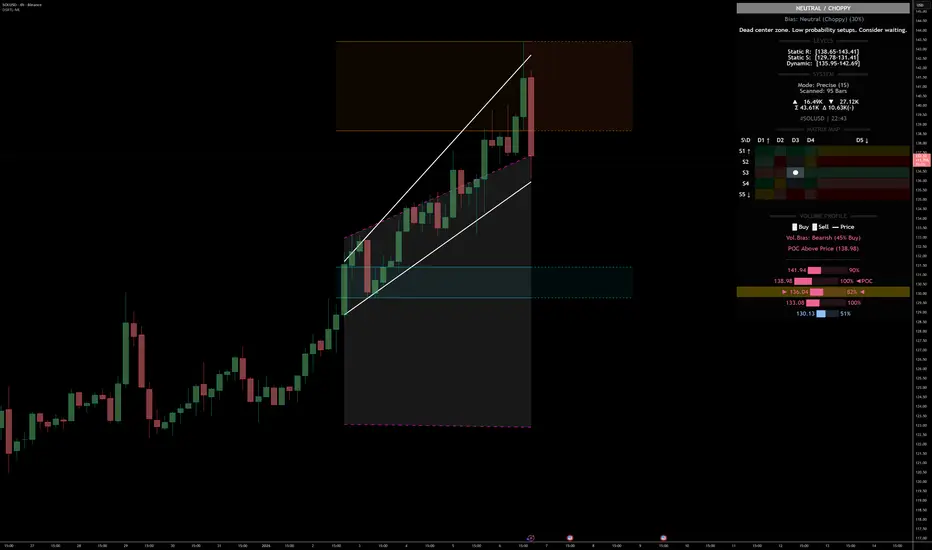
Using the DSRTL-ML engine, we have identified a "Neutral / Choppy" regime (S3-D3 State).The price is literally sitting in the dead center of the structure, sandwiched between dynamic buying and selling pressure.
1. The Structural Squeeze
The market is compressing. We are seeing a classic "Energy Build-up."
The algorithm flags this area as Low Probability for trend setups. Why? Because we are far from the "Iron Floor" (Value) and equally far from the "Iron Fortress" .
📐 CRITICAL LIQUIDITY LEVELS:
2. Order Flow & Delta Divergence
The Trap: Although price is trading ABOVE the Point of Control (POC at 133.08), the negative Delta indicates that every small rally is being sold into. The buyers are not aggressive here; they are merely absorbing. This divergence often precedes a liquidity flush or a fake-out.
🧠 The Smart Play (Scenario Logic)
We do not predict; we react to confirmed structure breaches.
🐂 Bull Confirmation: Price must reclaim 142.69 with positive Delta to prove buyers have absorbed the supply.
🐻 Bear Confirmation: A loss of the dynamic floor at 135.95 validates the negative delta and likely targets the 131.00 demand zone.
Current Verdict: Patience. Let the liquidity reveal its hand before committing capital.
⚠️ DISCLAIMER:
This reading is generated entirely by the algorithmic calculations and outputs of DSRTL-ML; it is absolutely NOT financial advice. Always Do Your Own Research (DYOR).
⏱️ REAL-TIME DATA SNAPSHOT:
Please note that the Volume, Delta, and Level figures presented below are captured at the exact moment of analysis. Since the DSRTL-ML algorithm processes live intrabar ticks in real-time, these numbers will naturally evolve and update on your chart as new market activity occurs from the time of writing to publication.
This analysis utilizes a 100% VOLUME-BASED ALGORITHM powered by Lower Timeframe (LTF) intrabar data. unlike standard Price Action, we are scanning the internal structure of every candle to pinpoint liquidity.
📊 DATA PRECISION USED:
For this specific SOL/USD reading, the system is running on 1S (1-Second) data resolution. This ensures that the Support/Resistance zones shown below are derived from real-time volume distribution, not just visual highs and lows.
💡 WHY THIS MATTERS:
Standard charts hide the battle between buyers and sellers. By using intrabar volume geometry, we filter out the noise and only focus on where the "Smart Money" is actually defending positions.
SOLUSD: Trapped in the "Dead Center" Liquidity Void 📉
Most traders guess where the breakout will happen. The math suggests we are currently in a "No-Trade Zone."
Using the DSRTL-ML engine, we have identified a "Neutral / Choppy" regime (S3-D3 State).The price is literally sitting in the dead center of the structure, sandwiched between dynamic buying and selling pressure.
1. The Structural Squeeze
The market is compressing. We are seeing a classic "Energy Build-up."
The algorithm flags this area as Low Probability for trend setups. Why? Because we are far from the "Iron Floor" (Value) and equally far from the "Iron Fortress" .
📐 CRITICAL LIQUIDITY LEVELS:
- Static Resistance (Supply Wall): [138.65 – 143.41]
- Dynamic Control Zone (Immediate Cap): [135.95 – 142.69]
- Static Support (Demand Floor): [129.78 – 131.41]
2. Order Flow & Delta Divergence
- Total Volume: 43.24K
- Net Delta: [color=red]-10.45K (Sellers Dominant)[/color]
The Trap: Although price is trading ABOVE the Point of Control (POC at 133.08), the negative Delta indicates that every small rally is being sold into. The buyers are not aggressive here; they are merely absorbing. This divergence often precedes a liquidity flush or a fake-out.
🧠 The Smart Play (Scenario Logic)
We do not predict; we react to confirmed structure breaches.
🐂 Bull Confirmation: Price must reclaim 142.69 with positive Delta to prove buyers have absorbed the supply.
🐻 Bear Confirmation: A loss of the dynamic floor at 135.95 validates the negative delta and likely targets the 131.00 demand zone.
Current Verdict: Patience. Let the liquidity reveal its hand before committing capital.
⚠️ DISCLAIMER:
This reading is generated entirely by the algorithmic calculations and outputs of DSRTL-ML; it is absolutely NOT financial advice. Always Do Your Own Research (DYOR).
⏱️ REAL-TIME DATA SNAPSHOT:
Please note that the Volume, Delta, and Level figures presented below are captured at the exact moment of analysis. Since the DSRTL-ML algorithm processes live intrabar ticks in real-time, these numbers will naturally evolve and update on your chart as new market activity occurs from the time of writing to publication.

Measuring markets through Volume Dynamics & Geometric Frameworks.
For invite-only script access, DM on TradingView or via x.com/sabanci_ata
For invite-only script access, DM on TradingView or via x.com/sabanci_ata
Related publications
Disclaimer
The information and publications are not meant to be, and do not constitute, financial, investment, trading, or other types of advice or recommendations supplied or endorsed by TradingView. Read more in the Terms of Use.