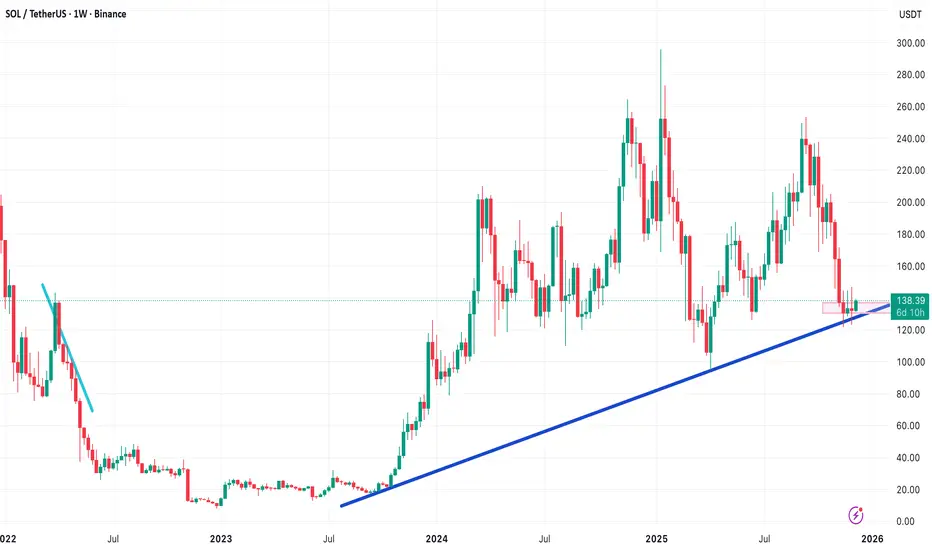
Solana is currently trading at a high-stakes technical level, sitting directly on its major weekly ascending trendline. This area is extremely important and could determine the next mid-term direction of the market.
📉 Bearish Scenario
If the ascending trendline and the key support at $130 break down with a strong confirmation candle and price closes below this level, a deeper correction becomes likely.
Potential downside targets:
$120
$112
$99
These levels may act as important support zones where buyers could re-enter.
📈 Bullish Scenario
If Solana manages to break above the $137 resistance with a strong bullish candle, we may see the beginning of another upward move.
In this case, the pullback to $137 could offer a valid long entry.
Upside targets:
$150
$162
$171
These levels represent key mid-term resistances.
✅ Summary
Solana is positioned at a decision point on the chart.
A confirmed breakout or breakdown from this zone will likely set the trend for the coming weeks. Traders should closely monitor price action and candle confirmations around $130–$137.
Disclaimer
The information and publications are not meant to be, and do not constitute, financial, investment, trading, or other types of advice or recommendations supplied or endorsed by TradingView. Read more in the Terms of Use.
Disclaimer
The information and publications are not meant to be, and do not constitute, financial, investment, trading, or other types of advice or recommendations supplied or endorsed by TradingView. Read more in the Terms of Use.