
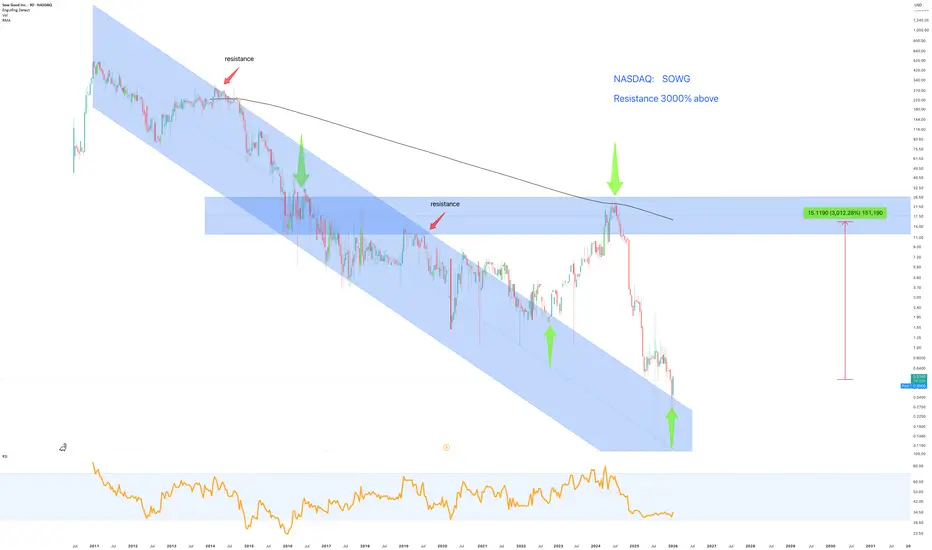
Ticker: SOWG (Sow Good Inc)
Timeframe: 9 day
** A "Don't be greedy, just be early" high risk tiny micro cap speculative play. **
Are you not entertained?
Core thesis
Sow Good has been living inside a big, ugly descending channel for years. The sort of trend that doesn't correct, it punishes. It recently tried a heroic breakout run into the big weekly resistance supply zone (the blue box) and got instantly slapped back down like it owed the market money.
Now price is back near the lower end of the long-term downtrend channel, where prior drops have historically at least paused to breathe. That's the bullish angle: Downtrend + return to the channel floor + price compression, the combination can create a high torque mean reversion bounce of buyers defend and we start printing higher lows.
This is not a "healthy uptrend continuation", this is a maybe the selling finally gets tired trade. High risk, high reward, and only valid if the base holds.
Key levels
Support (Base / “Stop Digging” Zone)
$0.45 – $0.60: Current weekly floor area (and near the channel’s lower boundary).
Bulls want to see weekly closes holding here and a higher low form.
Invalidation
Meaningful weekly close below ~$0.40 (or a clean breakdown to fresh lows).
If price loses this area, the “support” was just a speed bump on the way to misery.
Resistance targets
Treat these as reaction zones as places to take some off, not places to start writing speeches about “conviction.”
T1: ~$1.00
First psychological + structure checkpoint. If it can’t even tag $1, it’s not a reversal, it’s just noise.
T2: ~$2.50 – $3.00
Prior congestion / pivot zone. Expect chop and profit-taking here.
T3: ~$6.00 – $7.50
Mid-range mean reversion inside the broader downtrend ecosystem. This is where rallies often start wheezing.
T4: ~$14.00 – $16.00 (Major Weekly Supply Zone)
The big one, the highlighted resistance area and the “3000% above” headline target from current levels. If price gets here, it’s not the time to get romantic. It’s the time to get paid.
Conclusion
SOWG is back at the lower boundary of its multi-year down channel, setting up a potential risk-defined bounce if $0.45–$0.60 holds and structure improves (higher lows). Upside targets stair-step from $1, to $3, to $6–$7, with the “proper” stretch move aiming back into $14–$16 weekly supply.
But remember: this is a chart that’s spent years disappointing people with enthusiasm. If support breaks, you don’t argue with it, you leave. Pride doesn’t pay.
Ww
==========================================================
Disclaimer
This is not financial advice. It’s a chart idea, it's me pointing at candles like they’re evidence in a court case. Nothing here is guaranteed, nothing here is a “signal,” and if you YOLO because a rectangle looked convincing, that’s between you and your bank.
Small caps can gap, spike, rug, dilute, and generally behave like they’ve had six espressos and no supervision. Manage risk, size appropriately, use stops that respect volatility, and assume you’re wrong by default because the market doesn’t care about your feelings or your rent.
I may hold a position at any time, and this idea can be invalidated without warning. If you lose money, don’t message me like I stole it. You clicked the buttons.
Trade active
Active on publication.Note
48hrs later, 25% richer.Just another day in the office whilst whilst crypto currency junkies feed the balance sheets of obscure crypto exchanges with their liquidations.
Note
50% since publication. So much win... Note
100% in 9 days... warming up... 
Disclaimer
The information and publications are not meant to be, and do not constitute, financial, investment, trading, or other types of advice or recommendations supplied or endorsed by TradingView. Read more in the Terms of Use.
Disclaimer
The information and publications are not meant to be, and do not constitute, financial, investment, trading, or other types of advice or recommendations supplied or endorsed by TradingView. Read more in the Terms of Use.