Check out my new blog post:
derzzycharts.com/blog-1/mind-the-gaps-bro
The SPX has more holes than the Swissy! We’re talking big swiss cheese holes. They are up, they are down, they are all around! So how can we see this playing out? Well we can look the momentum that is currently taking place and assume the upper gaps will be filled first. Its a stones throw away at roughly 3% upside.
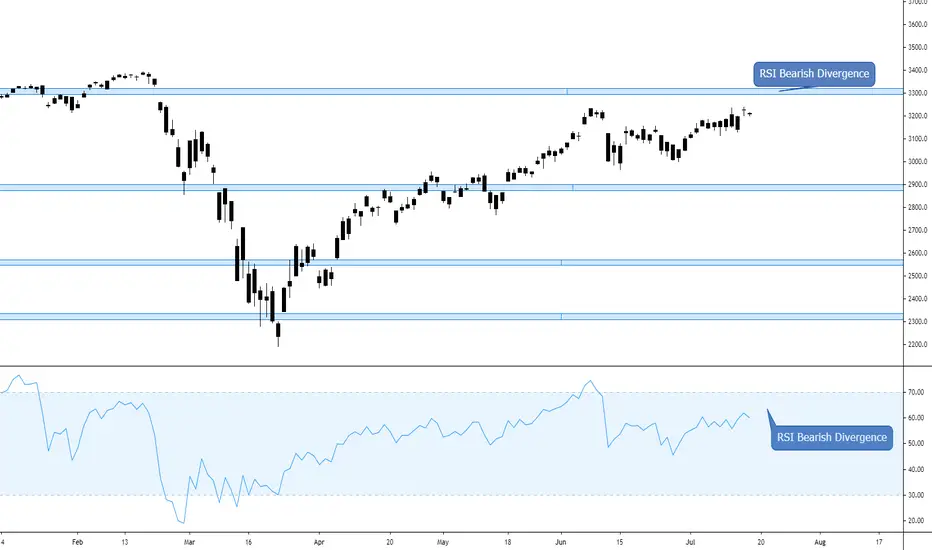
As for the other lower gaps? Well that is a little less certain. We would have to see volatility return with a vengeance to see that happen. We are talking VIX 50-70. If we go down to the last gap, I would say that we go below the 2200 support level. This would also give us room for a bullish divergence on the weekly RSI, which is a good indicator for the start of a new bull run. But for now, all we are looking for is a place to take some profit, and seeing an RSI bearish divergence on the daily would be a signal. We need to see the price put in a higher high and the RSI put in a lower high.
A key thing to remember here is these gaps don’t have to fill in the short term, or even at all! They could fill years down the road if we go to 4000 and go through a 50% correction. It is just important to know that they are there. We will stick to our process and be bullish until we see an RSI bearish divergence on the daily.
Happy Trading!
Brandon Anderson
brandon@derzzycharts.com
derzzycharts
derzzycharts.com
derzzycharts.com/blog-1/mind-the-gaps-bro
The SPX has more holes than the Swissy! We’re talking big swiss cheese holes. They are up, they are down, they are all around! So how can we see this playing out? Well we can look the momentum that is currently taking place and assume the upper gaps will be filled first. Its a stones throw away at roughly 3% upside.
As for the other lower gaps? Well that is a little less certain. We would have to see volatility return with a vengeance to see that happen. We are talking VIX 50-70. If we go down to the last gap, I would say that we go below the 2200 support level. This would also give us room for a bullish divergence on the weekly RSI, which is a good indicator for the start of a new bull run. But for now, all we are looking for is a place to take some profit, and seeing an RSI bearish divergence on the daily would be a signal. We need to see the price put in a higher high and the RSI put in a lower high.
A key thing to remember here is these gaps don’t have to fill in the short term, or even at all! They could fill years down the road if we go to 4000 and go through a 50% correction. It is just important to know that they are there. We will stick to our process and be bullish until we see an RSI bearish divergence on the daily.
Happy Trading!
Brandon Anderson
brandon@derzzycharts.com
derzzycharts
derzzycharts.com
Disclaimer
The information and publications are not meant to be, and do not constitute, financial, investment, trading, or other types of advice or recommendations supplied or endorsed by TradingView. Read more in the Terms of Use.
Disclaimer
The information and publications are not meant to be, and do not constitute, financial, investment, trading, or other types of advice or recommendations supplied or endorsed by TradingView. Read more in the Terms of Use.